Lesson 1. What is Lidar Data
Intro to Lidar Data - Earth analytics course module
Welcome to the first lesson in the Intro to Lidar Data module. Lidar is an active remote sensing technique that measures vegetation height. Learn more about discrete and full waveform LIDAR and how to use LIDAR data.Learning Objectives
After completing this tutorial, you will be able to:
- List and briefly describe the 3 core components of a lidar remote sensing system.
- Describe what a lidar system measures.
- Define an active remote sensing system.
What You Need
You will need a computer with internet access to complete this lesson.
If you have not already downloaded the week 3 data, please do so now. Download Week 3 Data (~250 MB)
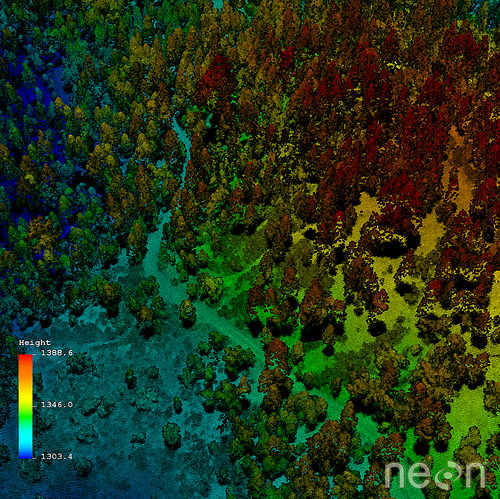
Lidar or Light Detection and Ranging is an active remote sensing system that can be used to measure vegetation height across wide areas.
Lidar Background
Watch the videos below to better understand what lidar is and how a lidar system works.
The Story of Lidar Data Video
How Lidar Works
Let’s Get Started - Key Concepts to Review
Why Lidar
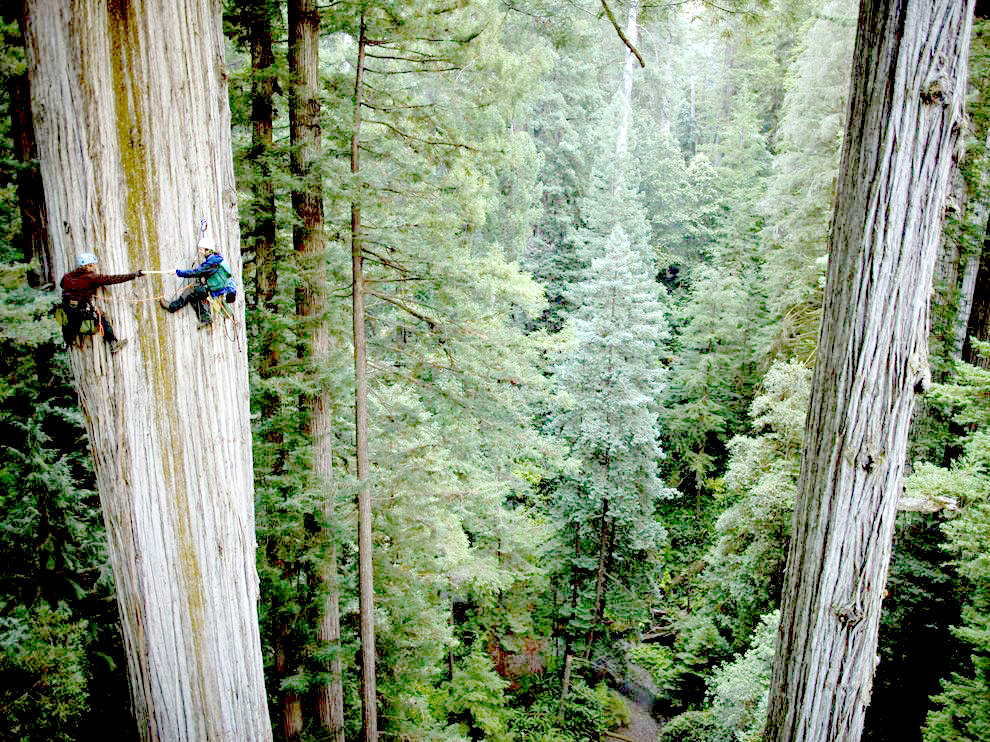
Scientists often need to characterize vegetation over large regions. We use tools that can estimate key characteristics over large areas because we don’t have the resources to measure each individual tree. These tools often use remote methods. Remote sensing means that we aren’t actually physically measuring things with our hands, we are using sensors which capture information about a landscape and record things that we can use to estimate conditions and characteristics.
To measure vegetation across large areas we need remote sensing methods that can collect many measurements quickly using automated sensors. These measurements can be used to estimate forest structure across larger areas. Lidar (also sometimes referred to as active laser scanning) is one remote sensing method that can be used to map structure including vegetation height, density and other characteristics across a region. Lidar directly measures the height and density of vegetation (as well as buildings and other objects) on the ground making it an ideal tool for scientists studying vegetation over large areas.
Lidar is an Active Remote Sensing System
Lidar is an active remote sensing system. An active system means that the system itself generates energy - in this case light - to measure things on the ground. In a lidar system, light is emitted from a rapidly firing laser. This light travels to the ground and reflects off of things like buildings and tree branches. The reflected light energy then returns to the lidar sensor where it is recorded.
A lidar system measures the time it takes for emitted light to travel to the ground and back. That time is used to calculate distance traveled. Distance traveled is then converted to elevation. These measurements are made using the key components of a lidar system including a GPS that identifies the X,Y,Z location of the light energy and an Internal Measurement Unit (IMU) that provides the orientation of the plane in the sky.
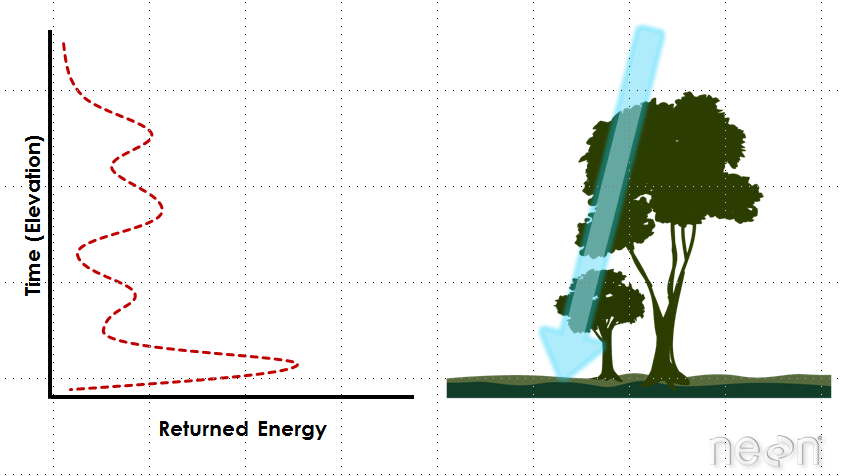
How Light Energy is Used to Measure Trees
Light energy is a collection of photons. As the photons that make up light move towards the ground, they hit objects such as branches on a tree. Some of the light reflects off of those objects and returns to the sensor. If the object is small and there are gaps surrounding it that allow light to pass through, some light continues down towards the ground. Because some photons reflect off of things like branches but others continue down towards the ground, multiple reflections may be recorded from one pulse of light.
The distribution of energy that returns to the sensor creates what we call a waveform. The amount of energy that returned to the lidar sensor is known as “intensity”. The areas where more photons or more light energy returns to the sensor create peaks in the distribution of energy. Theses peaks in the waveform often represent objects on the ground like a branch, a group of leaves or a building.
How Scientists Use Lidar Data
There are many different uses for lidar data:
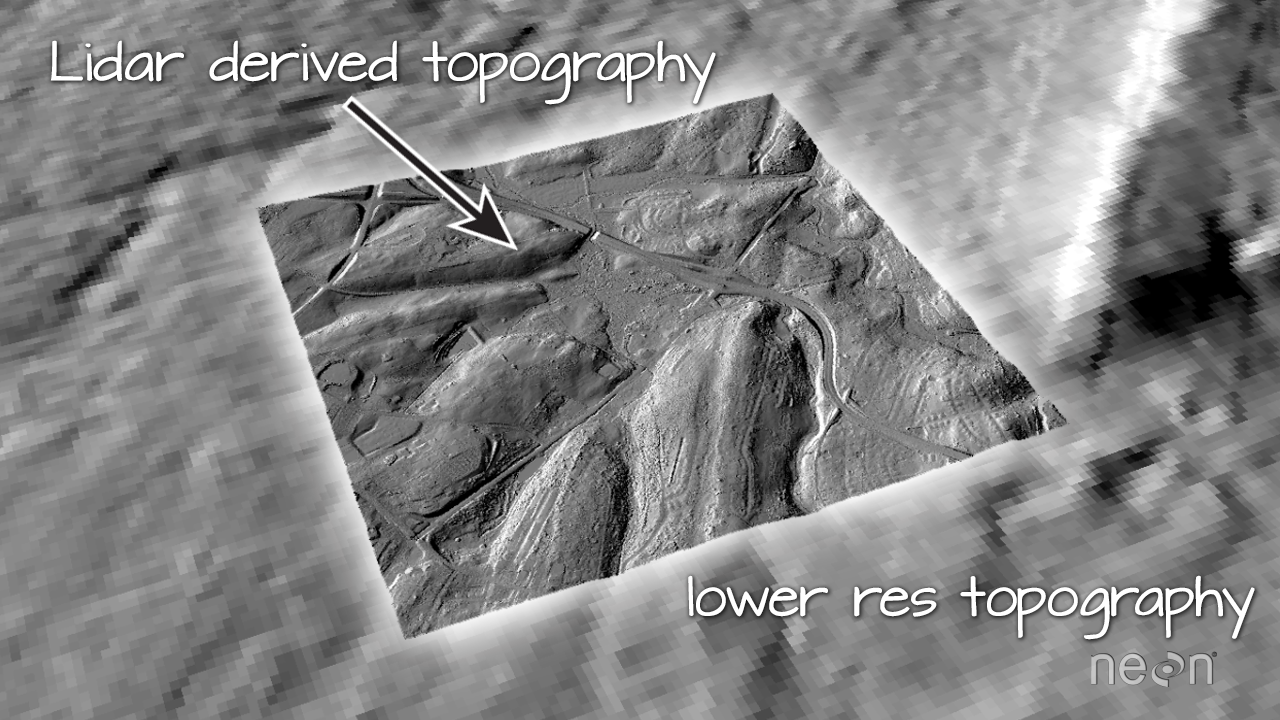
- Lidar data classically have been used to derive high resolution elevation data
- Lidar data have also been used to derive information about vegetation structure including:
- Canopy height
- Canopy cover
- Leaf area index
- Vertical forest structure
- Species identification (in less dense forests with high point density lidar)
Discrete vs. Full Waveform Lidar
A waveform or distribution of light energy is what returns to the lidar sensor. This return may be recorded in two different ways:
- A discrete return lidar system identifies individual (discrete) peaks and records a point at each peak location in the waveform curve. These discrete or individual points are called returns. A discrete system may record 1-4 (and sometimes more) returns from each laser pulse.
- A full waveform lidar system records a distribution of returned light energy. Full waveform lidar data are thus more complex to process, however, they can often capture more information compared to discrete return lidar systems.
Lidar File Formats
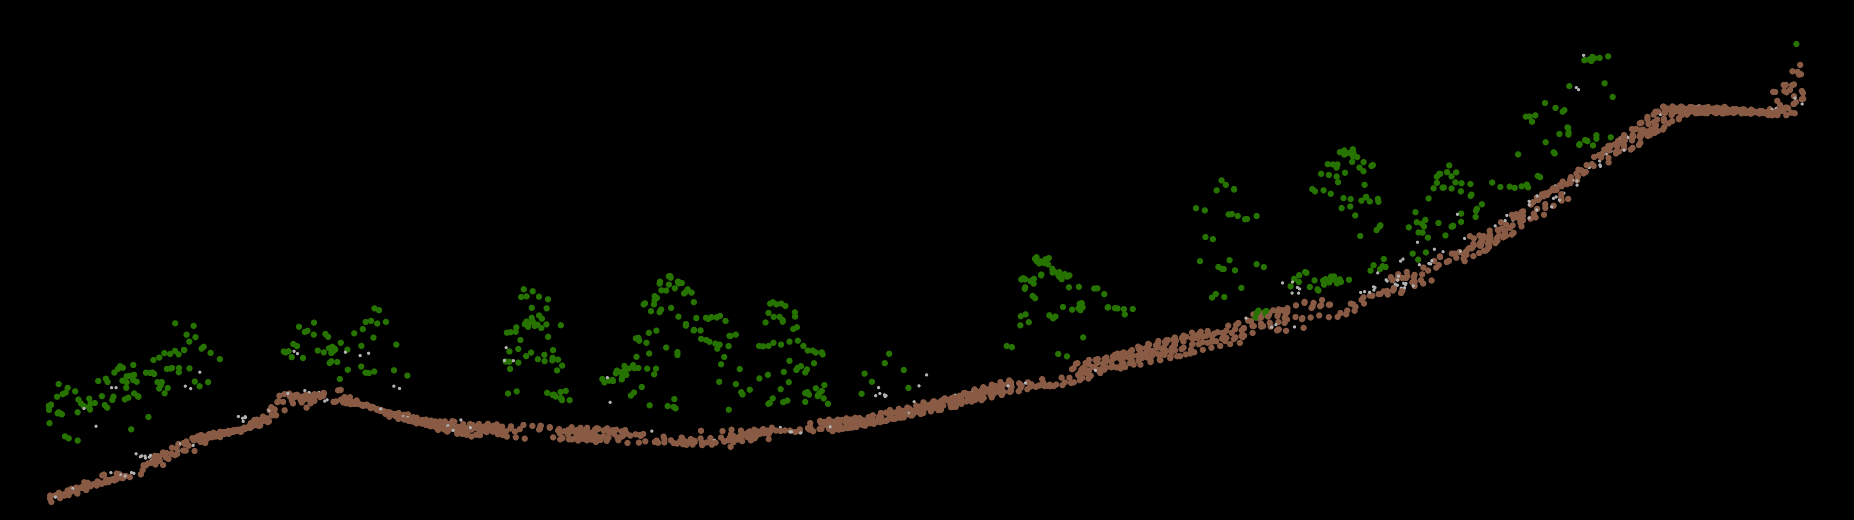
Whether they are collected as discrete points or full waveform, most often lidar data are available as discrete points. A collection of discrete return lidar points is known as a lidar point cloud.
The commonly used file format to store lidar point cloud data is the .las format. The .laz format is a highly compressed version of .las and is becoming more widely used.
Lidar Data Attributes: X, Y, Z, Intensity and Classification
Lidar data attributes can vary, depending upon how the data were collected and processed. You can determine what attributes are available for each lidar point by looking at the metadata.
All lidar data points will have:
- X,Y Location Information: determines the x,y coordinate location of the object that the lidar pulse (the light) reflected off of
- Z (elevation values): represents the elevation of the object that the lidar pulse reflected off of
Most lidar data points will have:
- Intensity: represents the amount of light energy recorded by the sensor.
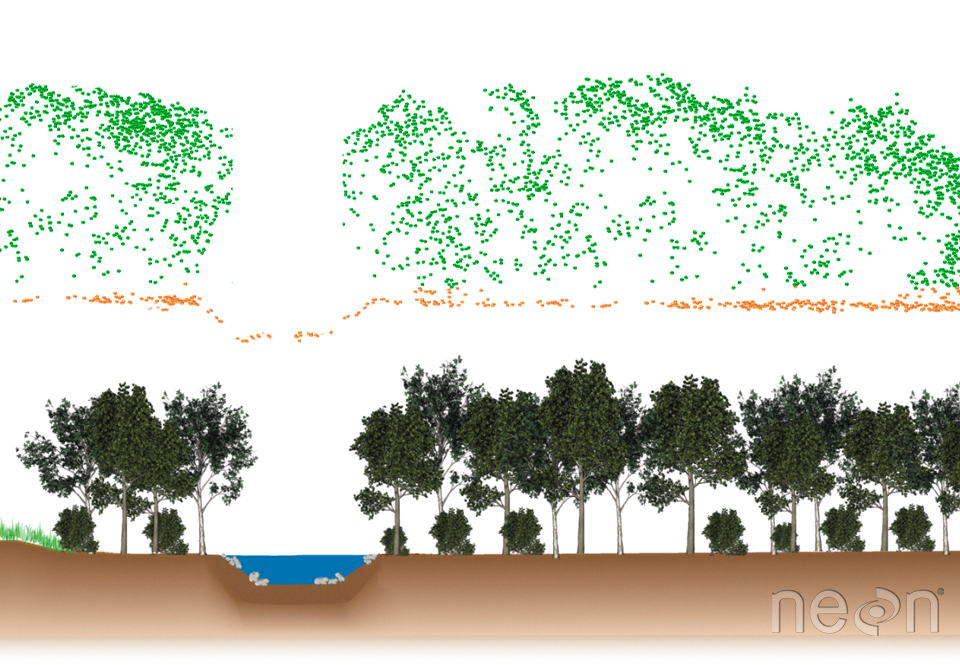
Classified Lidar Point Clouds
Some lidar point cloud data will also be “classified”. Classification refers to tagging each point with the object that it reflected off of. So if a pulse reflects off of a tree branch, you would assign it to the class “vegetation.” If the pulse reflects off of the ground, you would assign it to the class “ground.” Classification of lidar point clouds is an additional processing step. Classification simply represents the type of object that the laser return reflected off of. So if the light energy reflected off of a tree, it might be classified as “vegetation”. And if it reflected off of the ground, it might be classified as “ground”.
Some lidar products will be classified as “ground/non-ground.” Some datasets will be further processed to determine which points reflected off of buildings and other infrastructure. Some lidar data will be classified according to the vegetation type.
What is a Data Product?
A data product is the data that are DERIVED from an instrument, or information collected on the ground. For instance, you may go out in the field and measure the heights of trees at 20 plots then calculate an average height per plot. The average value is DERIVED from the individual measurements that you collected in the field.
When dealing with sensor data, the sensors often collect data in a format that needs to be processed in order to get usable values from it.
Share on
Twitter Facebook Google+ LinkedIn
Leave a Comment