Lesson 2.
| Create Data Driven Reports using Jupyter Notebooks | 2013 Colorado Flood Data |
A well documented scientific workflow is valuable because it makes it easier for us all to build off of each other’s work. Below you will consider the elements of a well-documented workflow using Jupyter Notebooks.
Learning Objectives
After completing this tutorial, you will be able to:
- List some of the components of a project that make it more easily re-usable (reproducible) to you when working with other people
What You Need
You will need a computer with internet access to complete this activity.
A Data Report
Your colleague put together the very informative data report below. The topic of the report is the 2013 Colorado floods. Examine the report. Then answer the questions below.
What sources of data were used to create the plots?
How were the data processed?
How did your colleague generate this report? When was it last updated?
Who contributed to this report?
You’d like to make some changes to the report - can you do that easily? If you wanted to make changes, what process and tools would you use to make those changes?
What units are the precipitation data in?
Create a list of the things that would make editing this report easier.
My Report - 2013 Colorado Flood Data
Precipitation Data
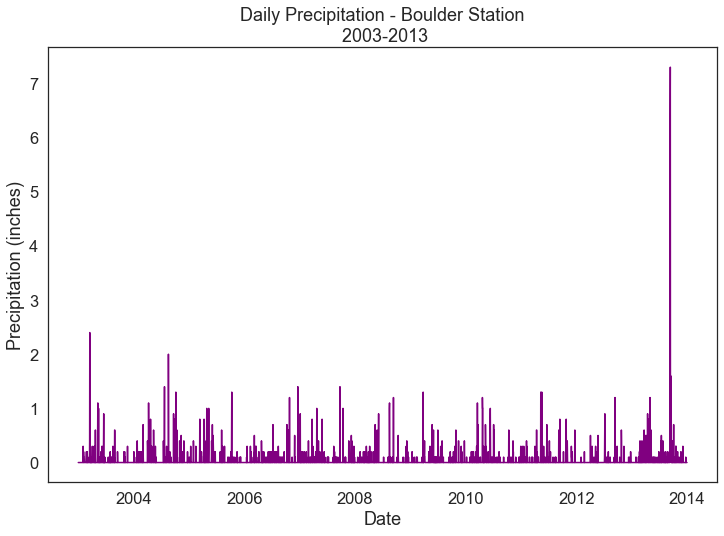
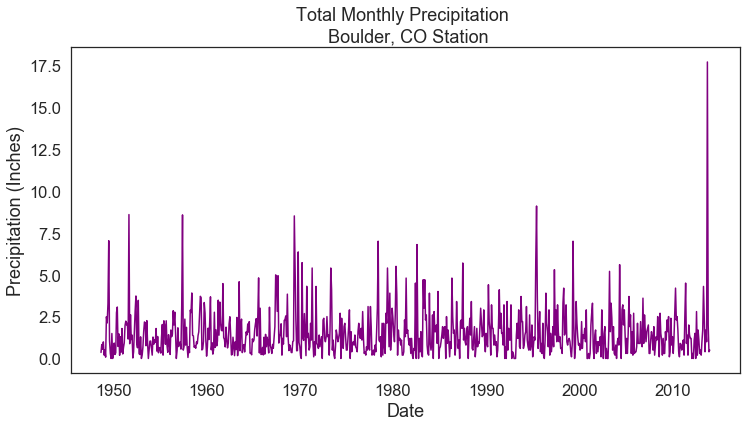
A lot of rain impacted Colorado. See below.
Downloading from https://ndownloader.figshare.com/files/7010681
Downloading from https://ndownloader.figshare.com/files/7010681
| STATION | STATION_NAME | ELEVATION | LATITUDE | LONGITUDE | DATE | HPCP | Measurement Flag | Quality Flag | |
|---|---|---|---|---|---|---|---|---|---|
| 0 | COOP:050843 | BOULDER 2 CO US | 1650.5 | 40.03389 | -105.28111 | 20030101 01:00 | 0.0 | g | |
| 1 | COOP:050843 | BOULDER 2 CO US | 1650.5 | 40.03389 | -105.28111 | 20030201 01:00 | 0.0 | g | |
| 2 | COOP:050843 | BOULDER 2 CO US | 1650.5 | 40.03389 | -105.28111 | 20030202 19:00 | 0.2 | ||
| 3 | COOP:050843 | BOULDER 2 CO US | 1650.5 | 40.03389 | -105.28111 | 20030202 22:00 | 0.1 | ||
| 4 | COOP:050843 | BOULDER 2 CO US | 1650.5 | 40.03389 | -105.28111 | 20030203 02:00 | 0.1 |

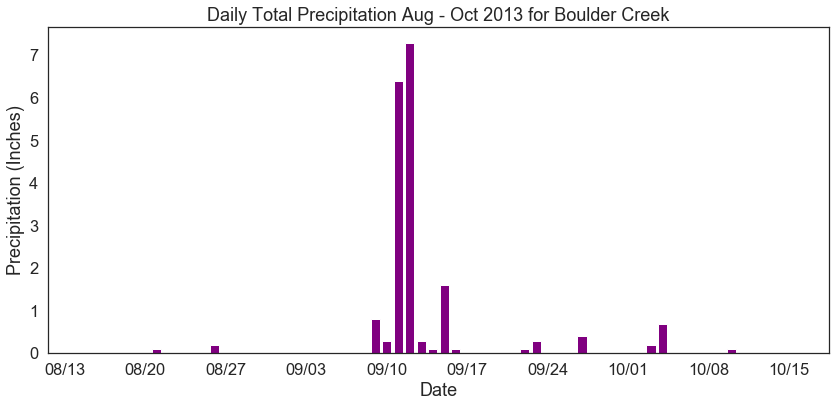
Fall 2013 Precipitation
Let’s check out the data for a few months.


Share on
Twitter Facebook Google+ LinkedIn
Leave a Comment