layout: true .logo[  ] --- name: inverse class: center, middle, inverse, full background-image: url(https://earthdatascience.org/images/slide-shows/earth-analytics-course/wk1-intro-earth-analytics/image1.jpg) # Earth Analytics ### GEOG 5563/4563 Instructor: Leah A. Wasser, Ph.D. ??? Welcome to Earth Analytics - GEOG 4563 / 5563 --- ## About this presentation * Created using `markdown` (you will learn markdown syntax in your week 1 homework) * Hit "p" to see the slide notes * Hit "f" to view the presentation full screen --- class: middle ## Earth Data Analytics Professional Certificate * This course is the **second** in a series * Earth Analytics Bootcamp (GEOG 5463) * Earth Analytics (GEOG 5563) * Earth Analytics Applications (GEOG 5663) * Graduate level course * Assumes knowledge of `Python`, `bash` and `Git` taught in GEOG 5463 --- name: inverse class: left, inverse ### We have students learning both online and in person * 4 Undergraduate students * 9 Graduate students * 10 Professional students ??? Please note that we have people participating in the course both online and in person this fall! Thus we will adjust how the course is taught based on that throughout the semester! Also note that our course includes a mixture of students from various backgrounds! --- class: middle, center ## Our class is diverse ??? We have students in this classroom from many different majors, degrees and backgrounds. --- name: inverse class: center, middle, inverse, full ## Weekly surveys GOAL: improve your experience in the course --- name: class: center, middle ## Survey results example: Weekly pace - Spring 2017 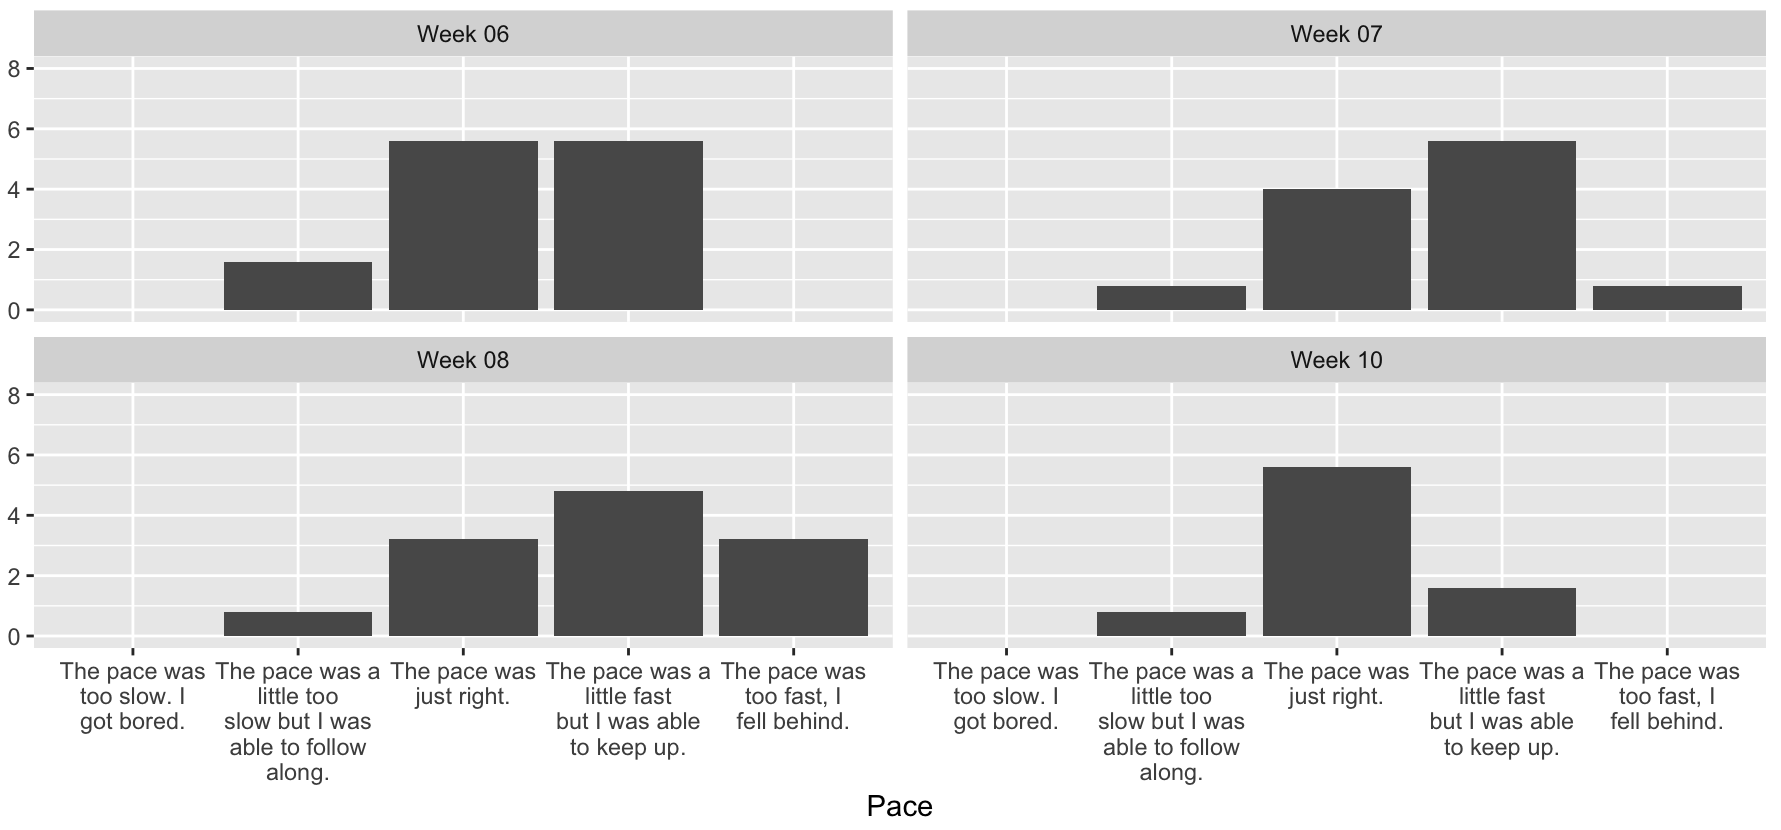 ??? The image above just shows the pace each week. I use this to adjust the course throughout the semester. --- name: inverse class: middle ## Help me improve your experience * Class surveys: emailed Mondays @9am * Check your "spam" or "junk" mail for the email! * Help me improve this class! ??? every week, I will be email u a survey through QUALTRICS. This survey is completely optional however I appreciate your taking it. It will allow me to adjust the course throughout the semester to ensure everyone is getting the best experience possible! it also will help be gauge how long the homework assignments are taking, how the pace of the class is for everyone... and more. I appreciate your help me improve this class! --- name: class: middle ## Help me improve your experience * Tell me what made sense and what didn't * Tell me how the pace was for you * Tell me what you wish you learned but didn't * I'll listen and adjust accordingly --- class:inverse, middle ## About your instructor * Background in remote sensing ecology * Learned data skills ... the hard way ??? I have a degree in ecology with a focus on remote sensing. I learned how to program because my dissertation data were so large -- gb of lidar point clouds and i needed a way to work with them. At the time I knew GIS- specifically ArcGIS very well. However, I had never programmed and didn't know a lot about dealing with point clouds. I tried to develop workflows in ArcGIS however i ran into problems trying to work with the huge datasets... everything crashed! Some friends got me started programming with Matlab ... the rest is history... I didn't think I could learn this stuff... I am not a programmer. I am a teacher and a scientist. If I can, you can learn it to. --- name: inverse class: middle, inverse background-image: url(https://earthdatascience.org/images/slide-shows/earth-analytics-course/wk1-intro-earth-analytics/image10.jpg) ## EARTH LAB  *funded by CU grand challenge* ??? I work for Earth Lab as the education director. Earth lab is funded by the CU grand challenge. --- class: center, middle, inverse # Earth lab mission harness the wave of observations from Space to better understand the pace and pattern of environmental change, from our backyards to our planet. ??? Our mission is to harness the power of the data deluge to address global environmental change. --- class: ## Earth Lab structure * **Analytics Hub:** computing support & infrastructure * **Science Projects:** transformational science in * **Earth Analytics Education:** data intensive earth systems education <a href="http://colorado.edu/earthlab" target="_blank">Visit earth lab website </a> --- name: inverse class: center, inverse, full background-image: url(https://earthdatascience.org/images/slide-shows/earth-analytics-course/wk1-intro-earth-analytics/image10.jpg) background-size: 100% 100% <br> ## Earth Lab is interdisciplinary <div style="padding:.5em 4.5em"> .small[Geography, Applied Mathematics, Ecology & Evolutionary Biology, Environmental Studies, Geological Sciences, Institute of Behavioral Science, National Snow and Ice Data Center, CIRES, and Research Computing] </div> ??? You can't address big science questions with only one discipline of expertise involved. Thus, Earth lab is interdisciplinary --- class: center, middle, inverse Earth Lab trains the next generation of Earth scientists to be the leaders in computationally intensive science. <a href="https://www.colorado.edu/earthlab/earth-analytics-education" target="_blank">Learn more about Earth analytics education.</a> --- class: center,middle,inverse ## Career development ### Data intensive science ??? Now that you know a bit about earth lab, let's talk about the goals of this class and how they fit into the realm of both understanding global change and what skills you need to get a job these days. --- class: center,middle,inverse # 4.4 million Data Scientists needed in 2015 #### Only 1/3 of these positions were filled. ??? In 2015 --- class: middle ## Skills required to address big questions with big data 1. Data skills (programming, efficient workflows, version control, command line) 2. Interdisciplinary collaboration skills 3. Communication -- to different audiences ??? As a part of my job at earth lab, i'm building a earth-analytics program. We are focused on understanding the job market and the skills that we should be teaching here at CU. So you get better jobs!! --- class: middle, center inverse ## Survey of hiring managers in academia & science *Earth Analytics Education Initiative, 2017 | Earth Lab* --- ## What skills are in demand? * **combination of data skills with science knowledge!** * work with large, ‘messy’ data sets to answer challenging science questions * write elegant, reproducible research-grade, code in `R` or `Python` * work with other scientists from a range of backgrounds * statistics ??? So what skills are in demand in the science - currently --- class: center, middle, inverse R vs. Python?? 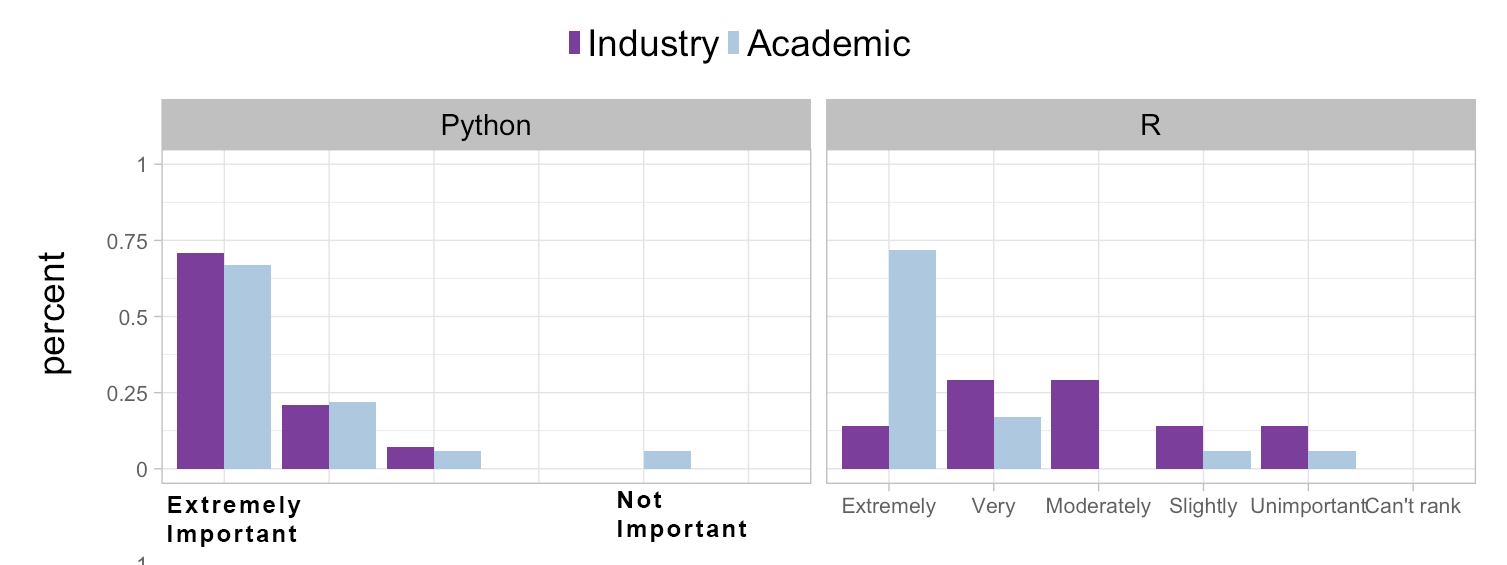 *just learn one well!* ??? One of the most popular question that people ask me are what language should I learn. Each language has it's benefits and associated challenges. The main take away is to learn one well. That knowledge to think programmatically transfers to other languages ONCE you have it. --- class: ## General skills you should learn <br> | Skill | Why | Examples | |:---------|:----------|:------| | **Unix command line** | Fast file manipulation, command line interfaces with tools (AWS, etc) | GitBash | | **Cloud computing** | | Amazon Web Services, Microsoft Azure | *GEOG 4463 / 5463 - Python Bootcamp - Augmester 2018 provides many of these skills.* ??? There are a set of skills that you would benefit from learning. The ones above are a good starting point. --- class: ## Programming skills you should learn <br> | Skill | Why | Examples | |:---------|:----------|:------| | **GPU / parallel programming** | Faster processing uses machine hardware | | | **Modular programming** | Easier to read, less repetitive code | Using functions, classes, etc | | **Code documentation** | | | *GEOG 4463 / 5463 - Python Bootcamp - Augmester 2018 provides many of these skills.* ??? There are a set of skills that you would benefit from learning. The ones above are a good starting point. --- class: ## Reproducible science skills you should learn <br> | Skill | Why | Examples | |:---------|:----------|:------| | **Containerized workflows** | Tools easily transferred to cloud / other machines | Docker | | **Databases** | Efficient data storage / access | sql, mysql, postgres | | **API data access** | | | *GEOG 4463 / 5463 - Python Bootcamp - Augmester 2018 provides many of these skills.* ??? There are a set of skills that you would benefit from learning. The ones above are a good starting point. --- class: center, middle, inverse ## Learn how to program and work with data... --- class: middle ## Open science & reproducibility * **Help your future self:** A well documented project is easier to work with 6 months down the road. ??? You may be wondering -- why should i care about open science and reproducibility. 1. Open science refers making your workflows open so that someone else can reproduce your work. This doesn't benefit the community of science of a whole but also benefits you. Imagine having to redo plots 6 months down the road after getting a journal review back. If your plots are easy to reproduce and your methods well documented... the time involved in redoing the effort will be less! --- class: middle ## Open science & reproducibility * **Push science forward:** Others can push forward the work that you're doing. You can push forward the work others are doing. ??? By documenting your work, the next person who picks it up doesn't have to start over. Also in a peer review process your methods are completely transparent. This helps science as a whole move forward --- class: center, middle, inverse ## Opportunities for cool science There are SO many sources of data available to use! --- class: middle, center ## NASA EOS data have increase 122 fold in 1 decade .smaller-image[] --- class: center, middle, inverse ## Remote sensing | collected from space 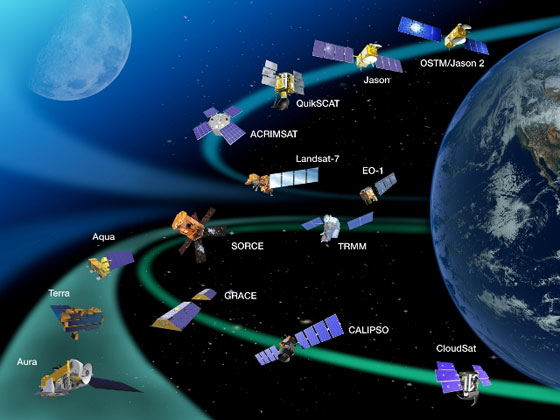 --- class: center, middle, inverse ## Remote sensing | collected from airplanes (and helicopters, drones, etc.) 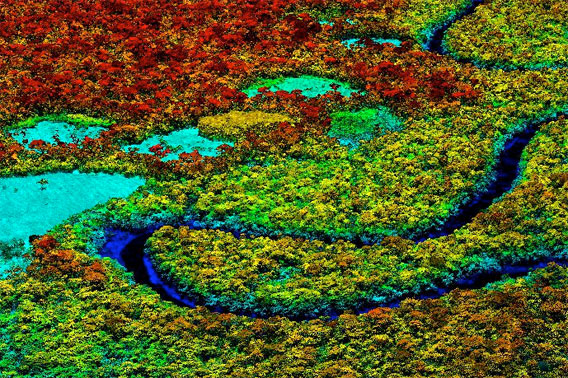 ??? Image shows a forest area with individual trees, colored by height. The densest biomass is red, while deforested areas — with low biomass — are shades of blue. Image courtesy of the Carnegie Airborne Observatory. Read more: http://news.mongabay.com/2012/0725-colombia-carbon-map.html#ixzz3OrjHTgXb --- class: center, middle, inverse ### NSF funded projects - NEON 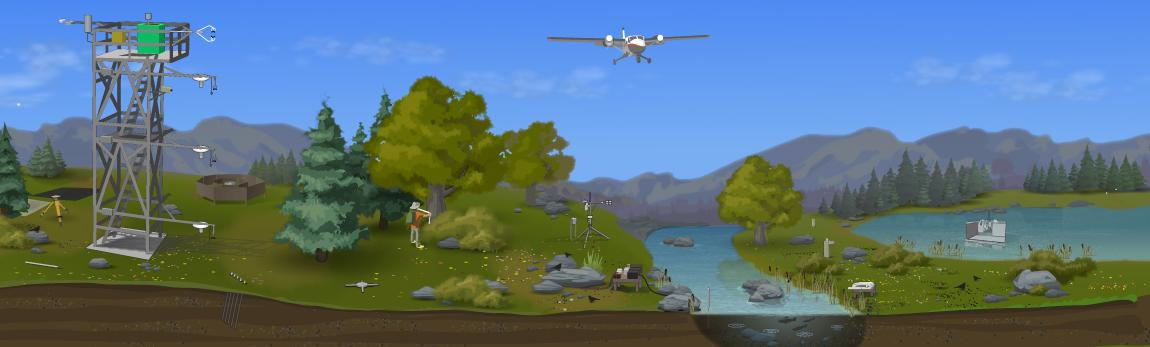 ??? NEON is collecting hyperspectral remote sensing data and lidar. All of these data are freely available but you need to know how to use it. --- class: ## Remote sensing data | what you need to know * Use spatial data formats * Deal with coordinate reference systems and spatial extents * What tools to use to process spatial data * How to handle various sources of uncertainty We will use some of this data this semester! ??? --- class: center, middle ### Data come from our daily lives too How many people are woken up by Earth Quakes in the California, Bay Area? 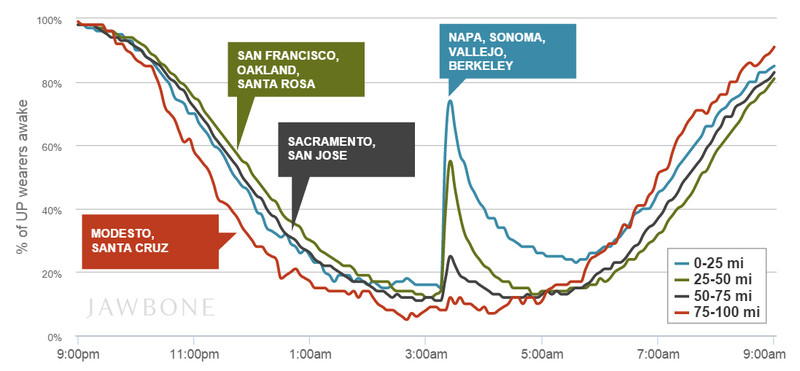 ??? Car emissions, citizen scientists, social media data, text analysis. From Jawbone, Earthquake in Napa in 2014: The recent earthquake in South Napa took many by surprise during the night, but to see just how many people woke up to the sound and physical disturbance, fitness tracking company Jawbone has released some anonymous data. The chart shared shows UP wearers in the Bay Area who track their sleep patterns. break A serious portion of UP wearers in Napa, Sonoma, Vallejo and Fairfield are located near the epicenter and were woken up, but it's interesting to see just how the impact gradually weakened as data from users who reside slightly further away is included. If you thought your UP was just for monitoring fitness, how about a secondary feature for earthquakes? --- class: center, middle, inverse ## Social media supports science too 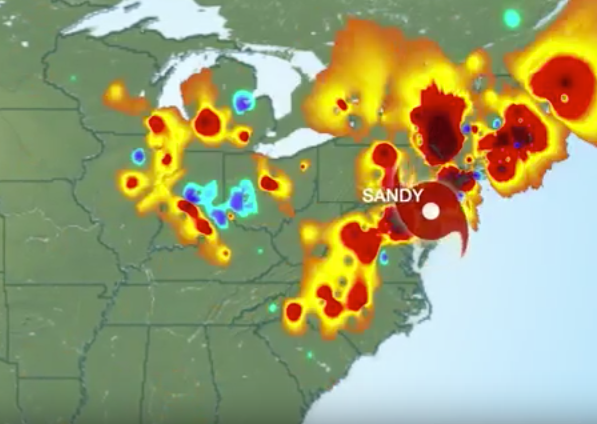 Hurricane Sandy Superstorm via Twitter --- class: center, middle, inverse ## Science communication --- class: center, middle, inverse ## Science is increasingly collaborative 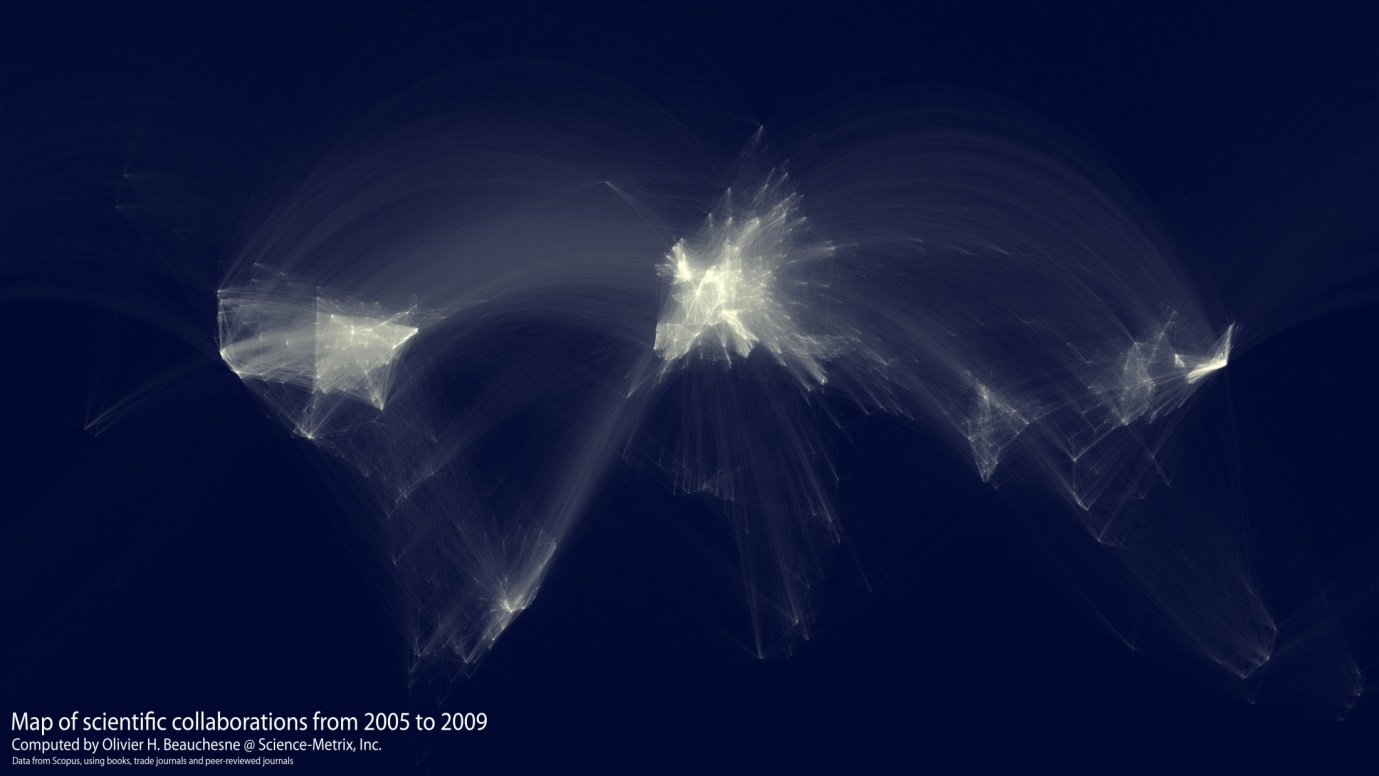 ??? Science is no longer just about individual researchers and labs. Science is becoming increasingly decentralized given communication tools like Slack, Github and even zoom! --- class: center,middle,inverse ## Imagine what we could do with seamless data integration… --- ### Quantify fires burning across the world 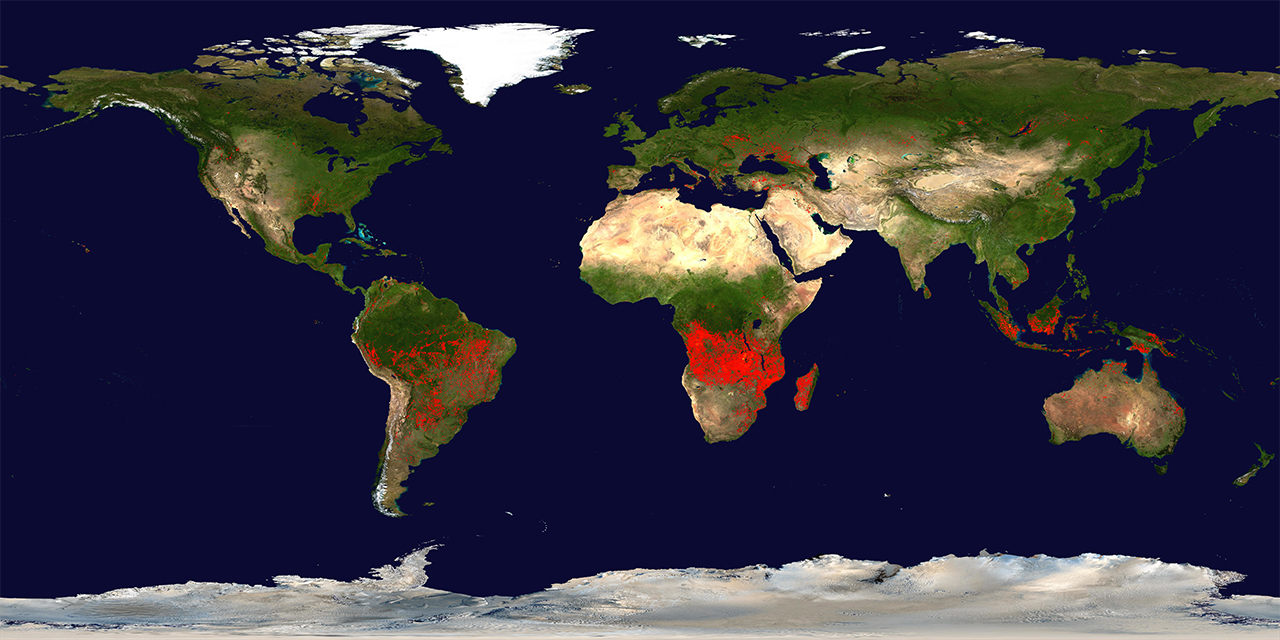 --- class: center,middle,inverse ## Predict future temperature change 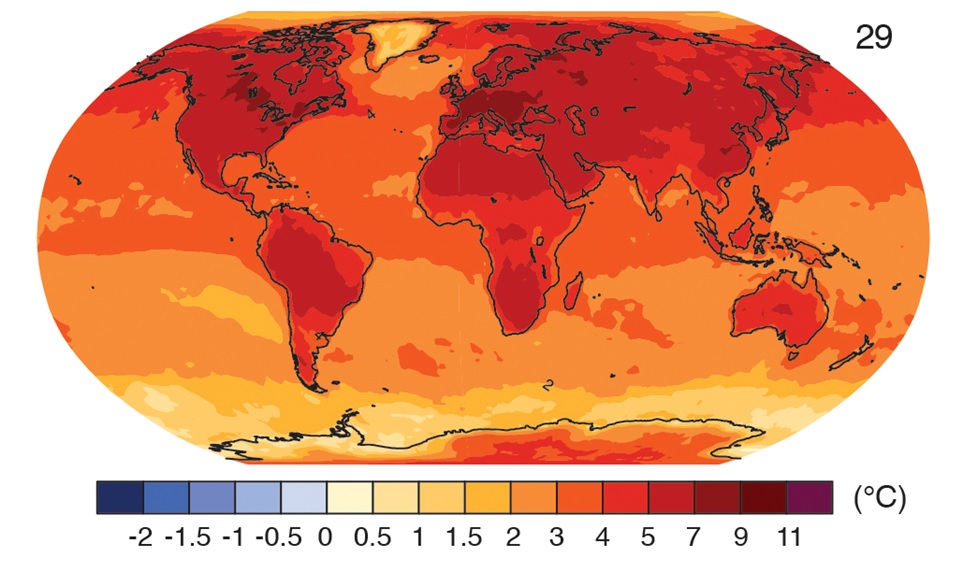 --- class: center,middle,inverse ## Predict landslide risk 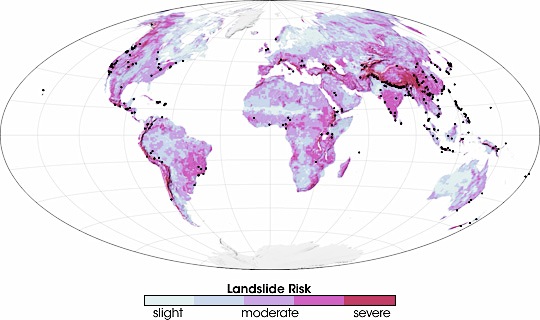 --- class: center,middle,inverse ## Understand biodiversity 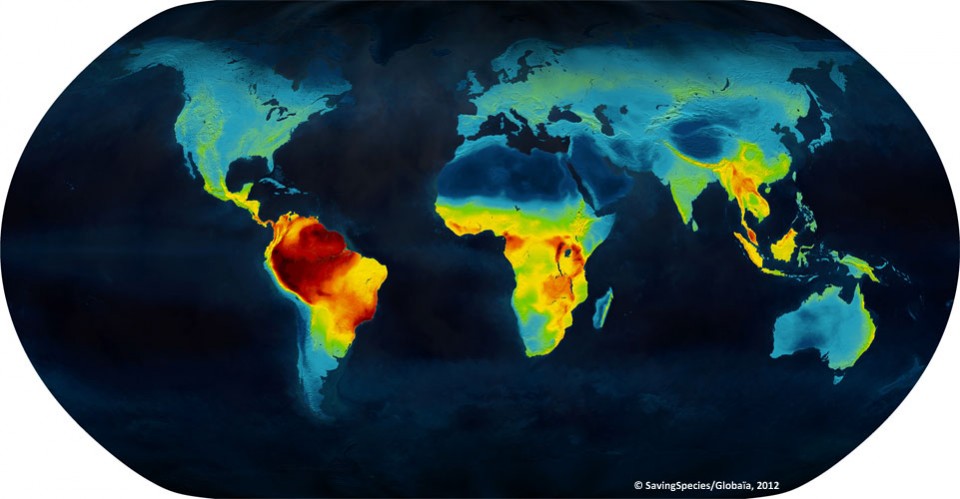 --- class: center,middle,inverse ## Quantify agricultural productivity 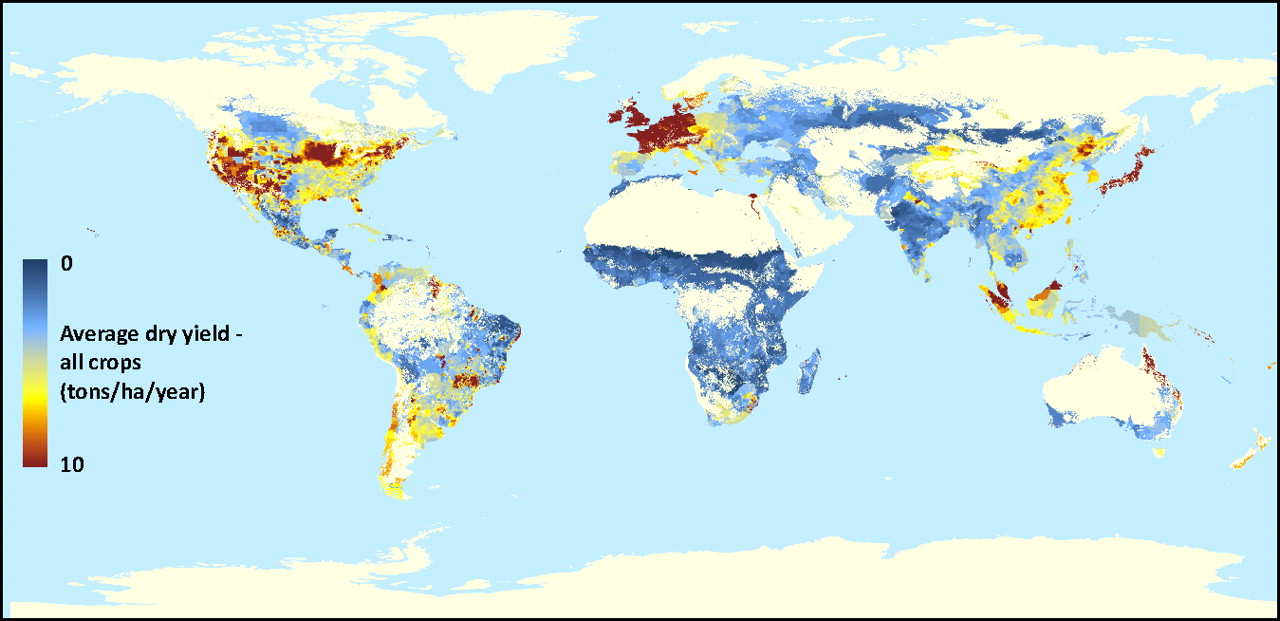 --- class: center,middle,inverse ## Map Shipping Networks 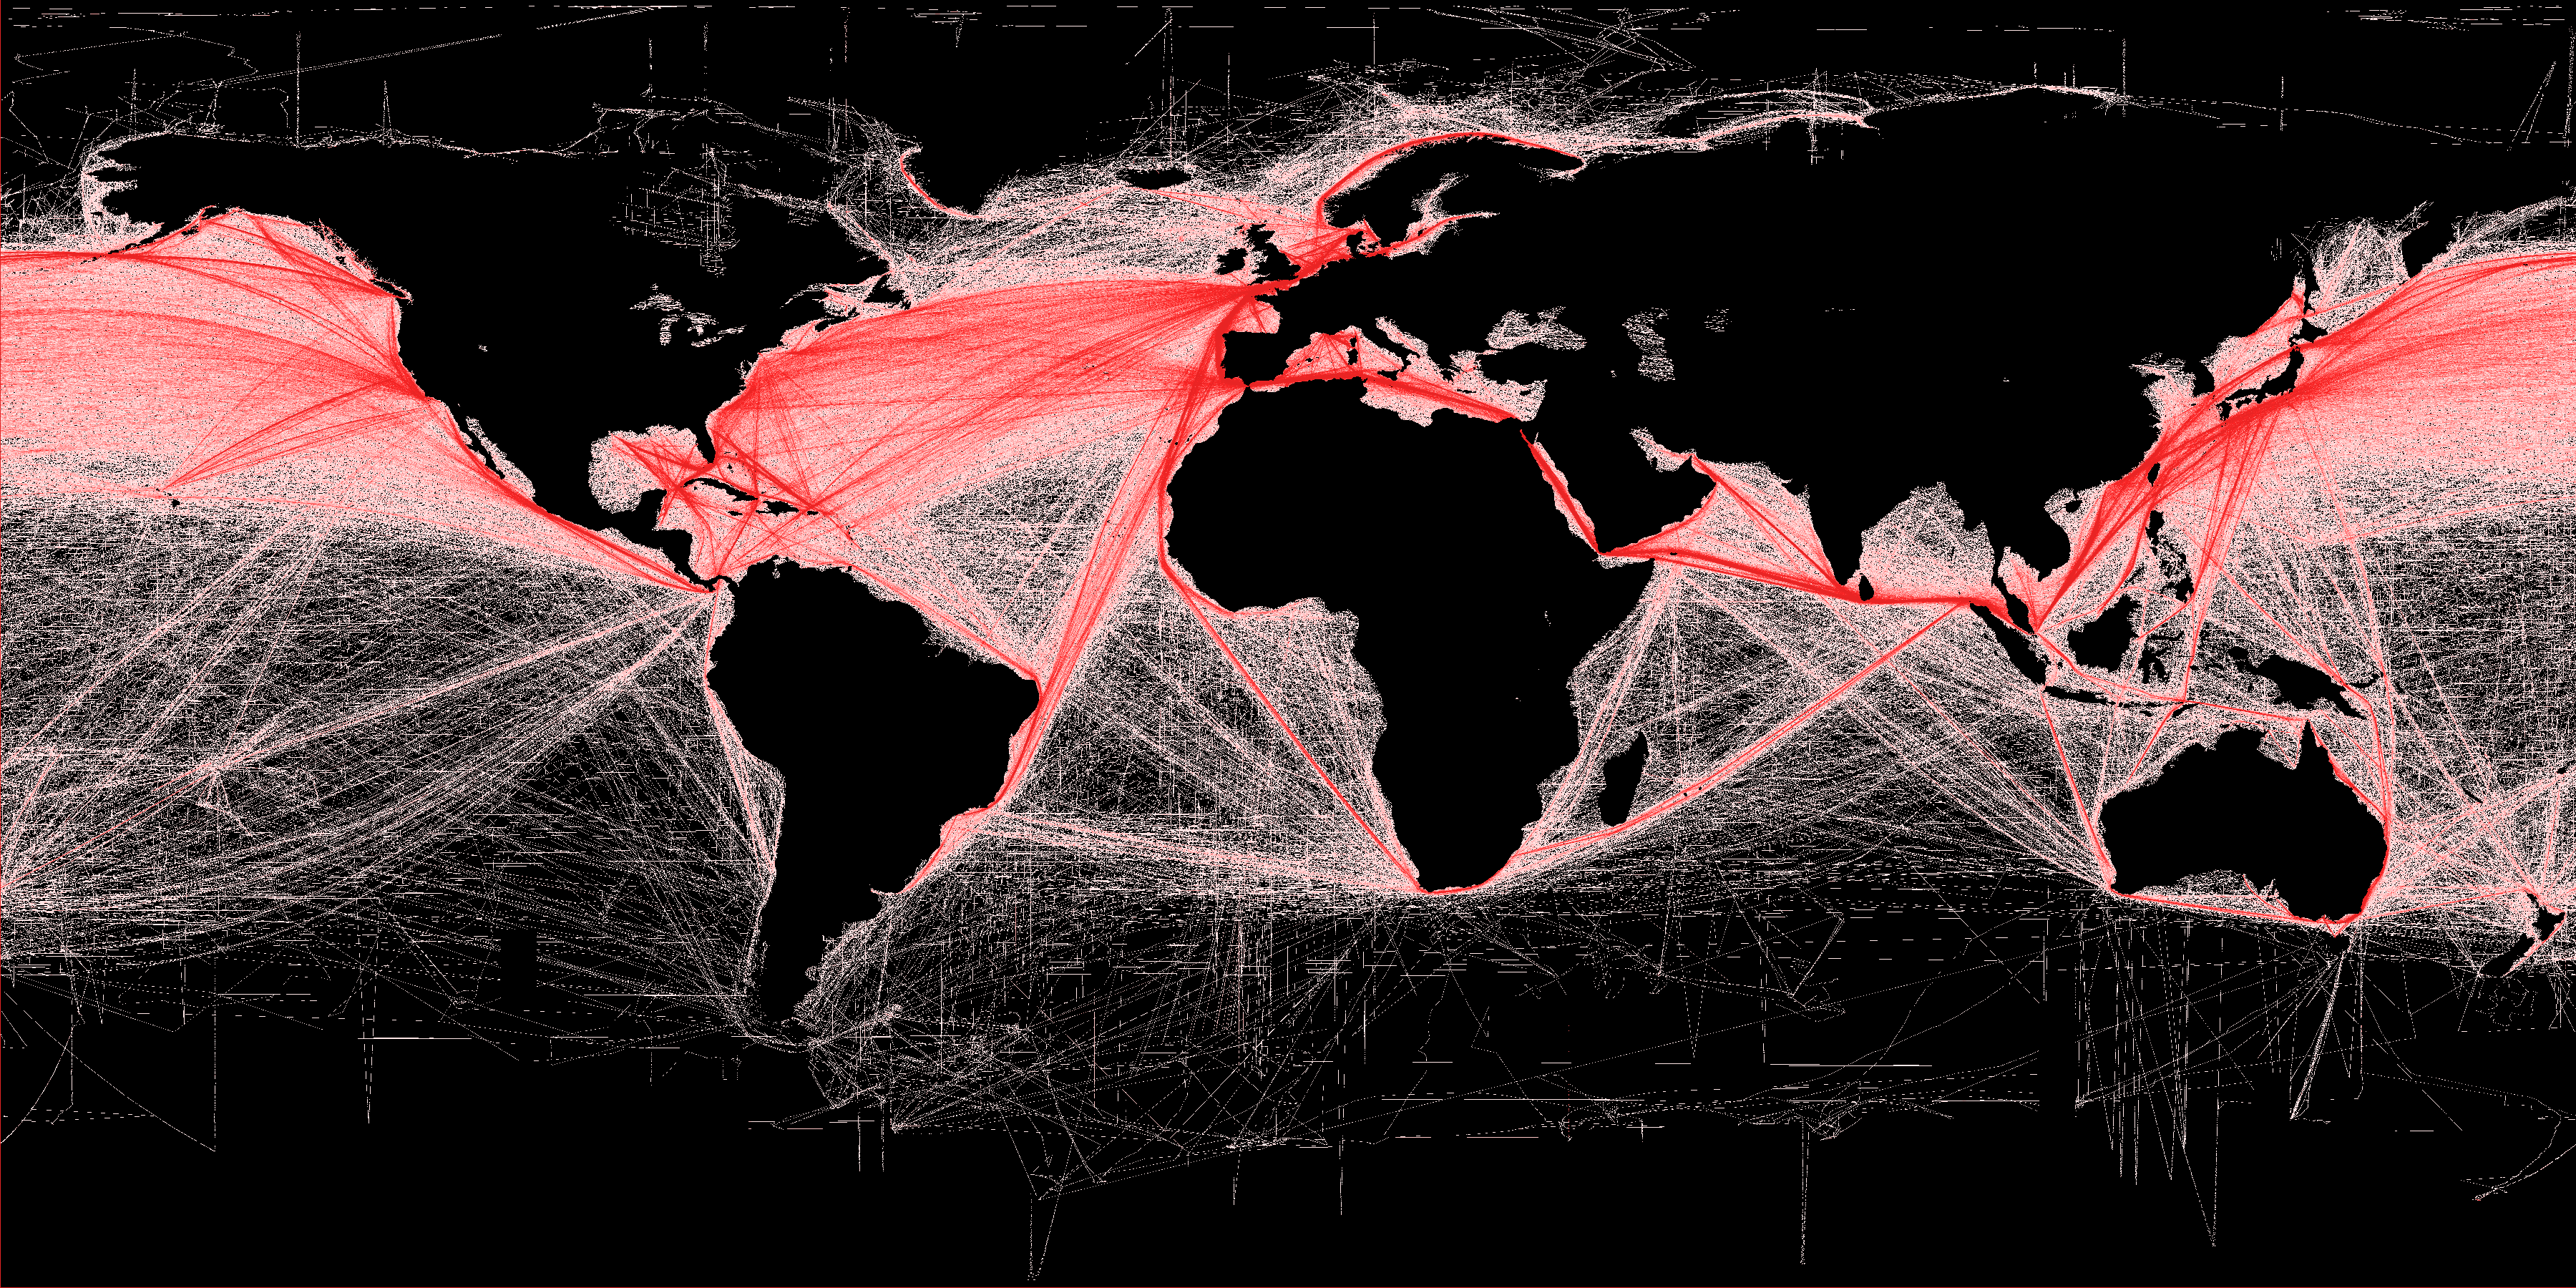 --- class: center,middle,inverse ## Billions of Tweets 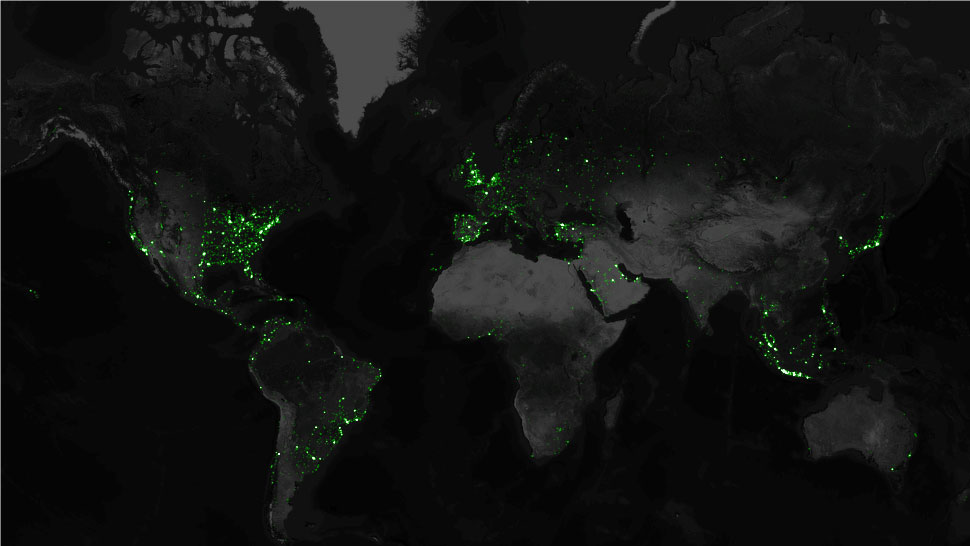 --- class: center,middle,inverse ## terra bytes - pedabytes of remote sensing data  --- class: ## Course learning objectives At the end of the semester you will be able to: * Work with and visualize a variety of data types from a variety of data sources * Use `Python` and `Jupyter Notebooks` to integrate, visualize, and analyze a variety of Earth System datasets to generate insights about the phenomenon of interest * Find and work with data that you need to address a science question --- class: inverse, middle ## GEOG 5563/4563 learning objectives * Download data programmatically use API's * Work with colleagues on a data intensive project * Communicate your science topic / goals to different audiences --- class: inverse, middle ## In this class * You will be challenged. * We will learn new tools. --- class: center, middle, inverse, full ## Atleast once ...  ??? http://www.relatably.com/m/funny-frustrated-memes --- class: full, center, middle ## Stick with it and cool things will happen .smaller-image[] <a href="http://hint.fm/wind/" target="_blank">Wind map</a> --- class: middle, inverse ## Get help * Help each other solve code challenges * Leave feedback on the bottom of the lesson that you are stuck on - * Post a question on <a href="https://piazza.com/colorado/fall2017/earthanalytics/home" target="_blank"> Piazza</a> * Answer a question on <a href="https://piazza.com/colorado/fall2017/earthanalytics/home" target="_blank"> Piazza </a> * Google is your friend --- class: center, middle, inverse # Review course syllabus [Click to view syllabus](https://earthdatascience.org/courses/earth-analytics-python/earth-analytics-syllabus/)