layout: true .logo[  ] --- name: inverse class: center, middle, inverse, full background-image: url(https://earthdatascience.org/images/slide-shows/earth-analytics-course/wk1-intro-earth-analytics/image1.jpg) # Present Your Science ## Earth Analytics Earth Lab, University of Colorado, Boulder Leah A. Wasser --- ## About This Presentation * Created using markdown * Hit "p" to see the slide notes * Hit "f" to view the presentation full screen --- ## Presentation Best practices * Keep slides simple * Be concise * Have 1 clear message * Avoid jargon (we have many different backgrounds in this class) --- class: center, middle ## If you're lucky... Your audience will learn / take away 3-5 things from your talk. --- class: center, middle ## Streamline your message --- ## Structure of a science talk * Introduce yourself * Background: * What are you studying? * Why should the audience care? * Include a study area context map! * Methods: What was your approach? * (**Important**) Results: * Conclusions / next steps --- class: middle .outline-header[intro] ## 1. Introduce yourself * Name, science background, major * Present your topic, clearly and concisely. ??? It is important to present yourself with confidence. Convince the audience that they should listen to you. Be sure to tell your audience who you are! In this case, include your major and your science background / interests Clearly present what topic or question you are researching. Everyone in the room should be able to describe your topic to someone else even if it's just in one sentence. --- class: center, inverse, middle # Background ??? It is important to present yourself with confidence. Convince the audience that they should listen to you. --- class: center, middle ## Why Should Your Audience Care? * Tell the audience why your topic is important - *to them* and others. * Provide a summary of what has already been done on this topic - context *A good background overview requires a literature review* .outline-header[background] ??? It is important to convince the audience that your topic is important. Make them care about the topic - concisely explain why it is relevant to them. Note that the audience that you are presenting to will determine in part how you explain the important. Examples: if you are presenting to a group of policy makers about climate, you may emphasize components that might impact both people, getting their constintuents support,etc. If you are presenting to a bunch of farmers, you may link climate to impacts on their farms, business, etc. --- class: center, middle .outline-header[make your message important] ## TOPIC: Impact of Climate Change on Precipitation & Drought > Audience: other scientists: > What is your message? ??? You are presenting the impacts of changes in climate on preipitation and draught to your scientific peers. What is your key message? What points do you cover? --- class: center, middle ## TOPIC: Impact of Climate Change on Precipitation & Drought > Audience: farmers > > What is your message? ??? How would your message change if you were presenting to say a group of farmers or landowners compared to scientists? What things might be the most important? --- class: center, middle ## TOPIC: Impact of Climate Change on Precipitation & Drought > Audience: your grandmother or mother > > What is your message? ??? What about your grandmother? How would you change your entire presentation and also your message? --- class: center, middle ## Create a Meaningful Study Area Map .outline-header[background] .smaller-image[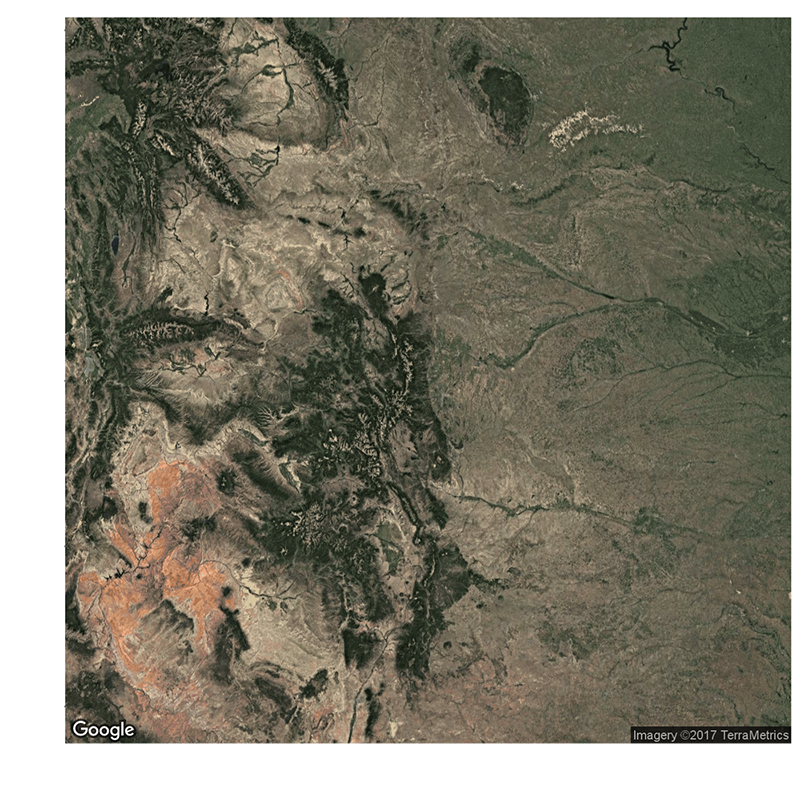] ??? Does this image tell you where this person is working? Don't just start "zoomed in". Give your audience context of where you are working. --- class: center, middle ## Provide Location Context .outline-header[background] .smaller-image[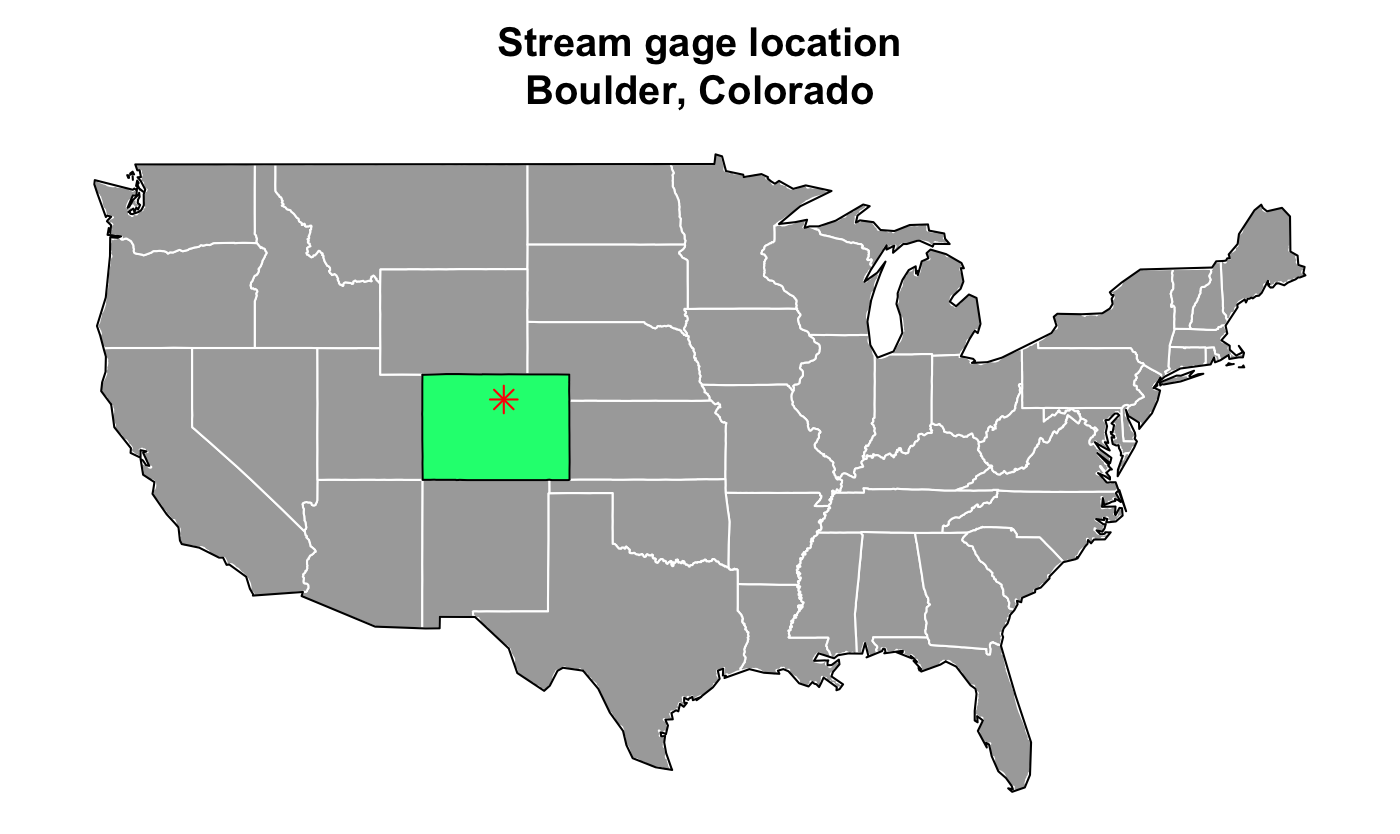] ??? Does this image tell you where this person is working? study-area-context --- class: center, inverse, middle ## Part 2: Methods ??? --- class: middle .outline-header[methods] ## Get To The Point * Present your methods CONCISELY * SUMMARIZE key method steps * Avoid too many details ??? Don't walk your audience through every step of the process. You don't have time and your audience will get bored. Summarize key steps. Your audience will get lost with too many details. Consider what is the most important and consider how much time you have to present. --- class: middle .outline-header[methods] ## What Data Will You Use? * Clearly articulate the data that you plan to use * Highlight any challenges that you anticipate ??? While I don't expect you to have the entire project figured out, I do expect that you have looked into the data and know that you can access it. We will grade you on whether you have explored the data or not (ie that you know you can get the data that you need and that you know how you'll work with it)! --- class: middle .outline-header[methods] ## What Data Will You Use? Include an image that shows some of your data. This will demonstrate you have actually explored the data. --- class: center, inverse, middle ## Results & Conclusions --- class: middle .outline-header[results] ## Emphasize the most important things * Present 2-3 most important findings * Explain why these findings are important * What are the next steps? ??? Remember that in general, people don't remember lots of details. In a presentation your goal should be that they walk away with 2-4 key points. It's not a lot but would you rather them walk away with nothing or a few key points and your contact information? --- class: middle .outline-header[slide best practices] ## Best Practices for Slides * Keep graphics simple * Make axis labels and titles large enought to read * Consider those in sitting in the back of the room! ??? Don't include graphics that are overly complex. Be sure to increase the font size on axis labels and titles. --- class: middle .outline-header[slide best practices] ## Whenever you present a graphic * Tell your audience what is on the x and y axis. Don't make them figure it out! * Explain any colors / legend values used ??? Don't include graphics that are overly complex. Be sure to increase the font size on axis labels and titles. Then walk your audience through all of the elements of a graphic. Yes this will take you additional time to explain! --- 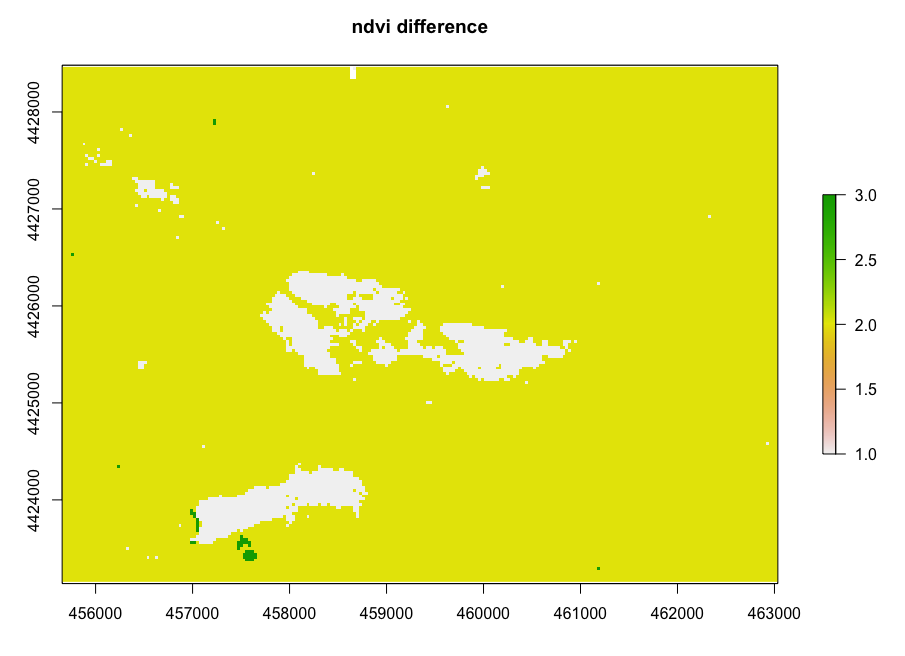 ??? What could you do to make this graphic more self-explanatory? --- 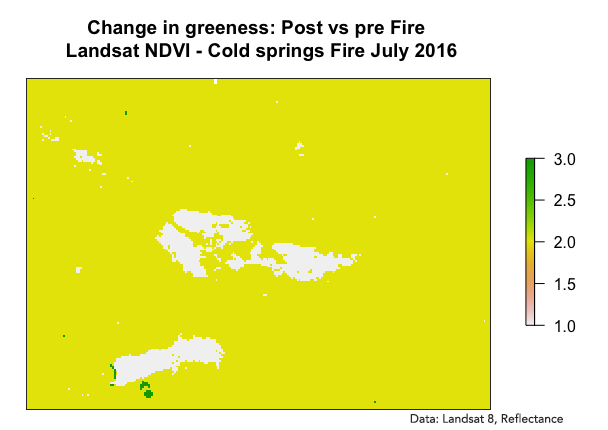 ??? *What about this one? Any better?* ---  ??? *How could we make this slide more self-explanatory?* ---  ??? Notice that by adjusting the title and fonts, your graphic can quickly become more readable --- class: middle .outline-header[slide best practices] ## Explain each axis and any colors used * Walk your audience through the x and y axis * Include units * Explain map legend colors ??? Remember that while you've spent a lot of time creating this plot, your audience hasn't seen it before. Walk them through it. that way they won't be focused on figuring out what the plot shows - you tell them that. They will then listen to you more closely! ---  *Explain the x and y axes and make sure the text is readable. Is this readable?* --- ## SUMMARY: Key parts of a presentation * Introduce yourself * Background: What are you studying? * **Why do we care about this topic?** * Methods: How did you approach your question / topic * **Key** Results: * Conclusions / next steps --- ## SUMMARY: Slide Best Practices * Keep slides simple * Minimize text * Highlight key messages * Keep plots & maps simple * Walk the audience through axes & legends * Use bold fonts that are easy to read for everyone in the room * Use easy to understand colors --- name: inverse class: center, middle, inverse ## The End