id = 'stars'
site_name = 'Gila River Indian Community'
project_name = 'Gila River Vegetation'
boundary_dir = 'tl_2020_us_aitsn'
event = 'water rights case'
start_year = '2001'
end_year = '2022'
event_year = '2012'Water Rights Restored to the Gila River
The impacts of irrigation on vegetation health in the Gila River Valley
In 2004, the Akimel O’otham and Tohono O’odham tribes won a water rights settlement in the US Supreme Court. Using satellite imagery, we can see the effects of irrigation water on the local vegetation.
- Open raster or image data using code
- Combine raster data and vector data to crop images to an area of interest
- Summarize raster values with stastics
- Analyze a time-series of raster images

Reclaiming Water Rights on the Gila River
The Gila River Reservation south of Phoenix, AZ is the ancestral home of the Akimel O’otham and Tohono O’odham tribes. The Gila River area was known for its agriculture, with miles of canals providing irrigation. However, in the 1800s, European colonizers upstream installed dams which cut off water supply. This resulted in the collapse of Gila River agriculture, along with sky-rocketing rates of diabetes and heart disease in the community as they were force to subsist only on US government surplus rations.
In 2004, the Gila River community won back much of its water rights in court. The settlement granted senior water rights nearly matching pre-colonial water use. Work has begun to rebuild the agriculture in the Gila River Reservation. According to the Akimel O’otham and Tohono O’odham tribes, “It will take years to complete but in the end the community members will once again hear the sweet music of rushing water.”
Observing vegetation health from space
We will look at vegetation health using NDVI (Normalized Difference Vegetation Index). How does it work? First, we need to learn about spectral reflectance signatures.
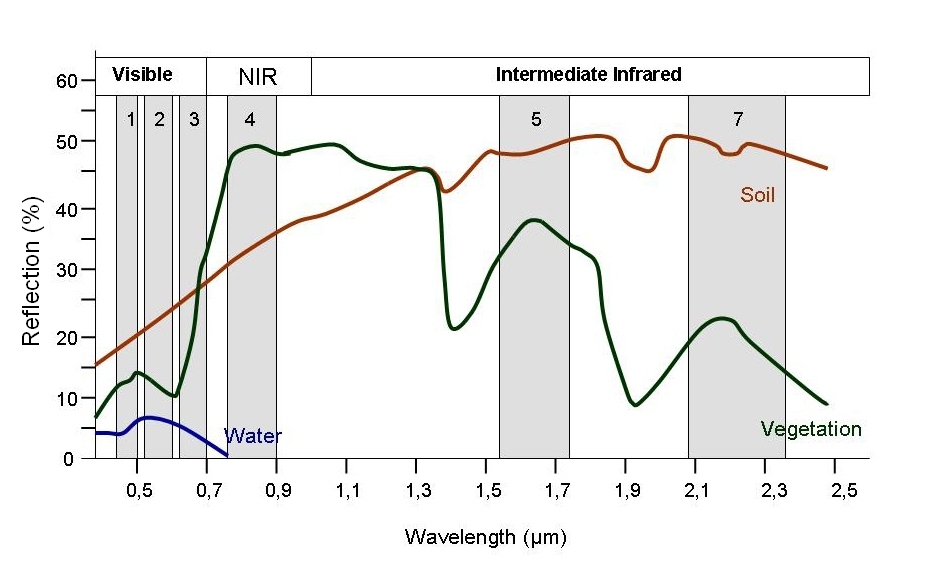
Every object reflects some wavelengths of light more or less than others. We can see this with our eyes, since, for example, plants reflect a lot of green in the summer, and then as that green diminishes in the fall they look more yellow or orange. The image below shows spectral signatures for water, soil, and vegetation:
 > Image source: SEOS Project
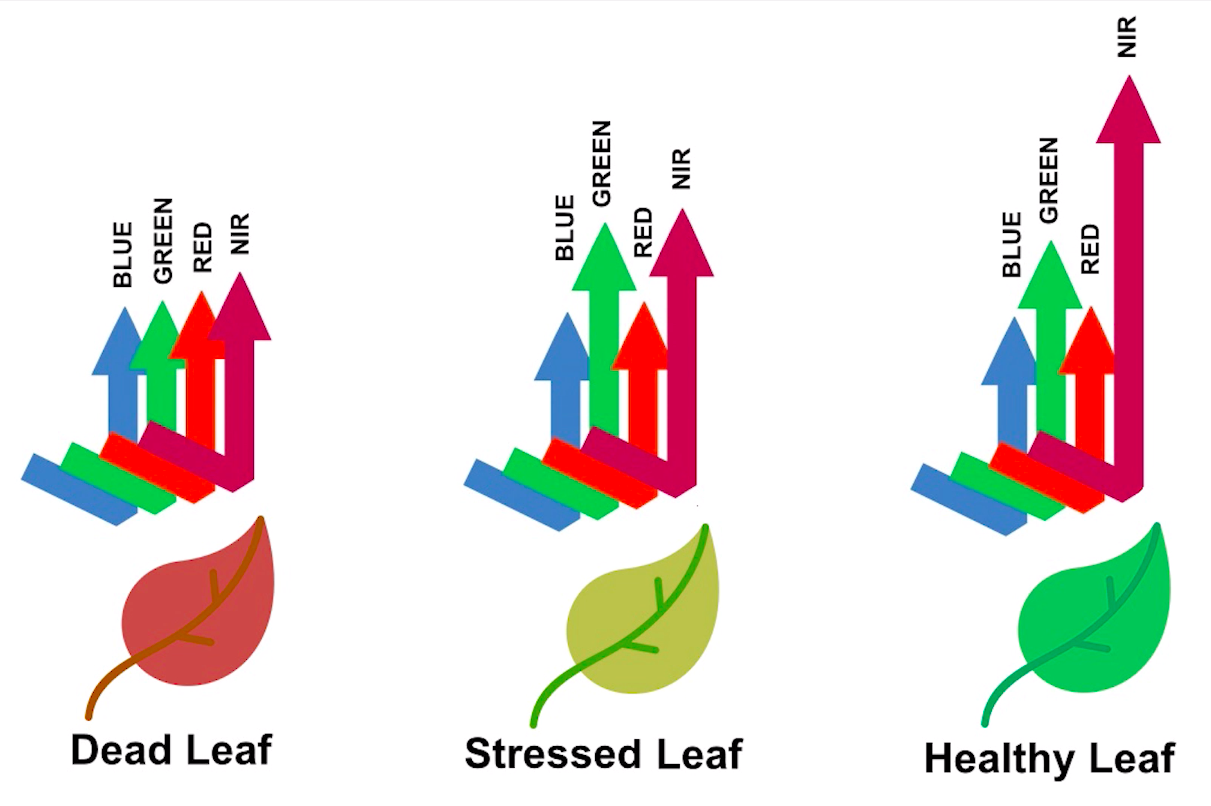
Healthy vegetation reflects a lot of Near-InfraRed (NIR) radiation. Less healthy vegetation reflects a similar amounts of the visible light spectra, but less NIR radiation. We don’t see a huge drop in Green radiation until the plant is very stressed or dead. That means that NIR allows us to get ahead of what we can see with our eyes.
 > Image source: Spectral signature literature review by px39n
Different species of plants reflect different spectral signatures, but the pattern of the signatures across species and sitations is similar. NDVI compares the amount of NIR reflectance to the amount of Red reflectance, thus accounting for many of the species differences and isolating the health of the plant. The formula for calculating NDVI is:
\[NDVI = \frac{(NIR - Red)}{(NIR + Red)}\]
Read more about NDVI and other vegetation indices:
STEP 0: Set up
First, you can use the following parameters to change things about the workflow:
Import libraries
We’ll need some Python libraries to complete this workflow.
In the cell below, making sure to keep the packages in order, add packages for:
- Working with DataFrames
- Working with GeoDataFrames
- Making interactive plots of tabular and vector data
What are we using the rest of these packages for? See if you can figure it out as you complete the notebook.
import json
from glob import glob
import earthpy
import hvplot.xarray
import rioxarray as rxr
import xarray as xrDownload sample data
In this analysis, you’ll need to download multiple data files to your computer rather than streaming them from the web. You’ll need to set up a folder for the files, and while you’re at it download the sample data there.
In the cell below, replace ‘Project Name’ with ‘Gila River Vegetation and ’my-data-folder’ with a descriptive directory name.
project = earthpy.Project(
'Project Name', dirname='my-data-folder')
project.get_data()Downloading from https://ndownloader.figshare.com/files/54896600
Extracted output to /home/runner/.local/share/earth-analytics/gila-river-vegetation/tl_2020_us_aitsn
Downloading from https://ndownloader.figshare.com/files/55242452
Extracted output to /home/runner/.local/share/earth-analytics/gila-river-vegetation/gila-river-ndviIf the water rights case took place in 2004, why are we listing the event year as 2012? It takes time for practices to adjust. You can experiment with different years to see if it affects the results.
STEP 1: Site map
Study Area: Gila River Indian Community
For this coding challenge, we are interested in the boundary of the Gila River Indian Community, and the health of vegetation in the area measured on a scale from -1 to 1. In the cell below, answer the following question: What data type do you think the boundary will be? What about the vegetation health?
Load the Gila River Indian Community boundary
- Locate the boundary files in your download directory
- Change
'boundary-directory'to the actual location - Load the data into Python and check that it worked
# Load in the boundary data
aitsn_gdf = gpd.read_file(project.project_dir / 'boundary-directory')
# Check that it worked| AIANNHCE | TRSUBCE | TRSUBNS | GEOID | NAME | NAMELSAD | LSAD | CLASSFP | MTFCC | FUNCSTAT | ALAND | AWATER | INTPTLAT | INTPTLON | geometry | |
|---|---|---|---|---|---|---|---|---|---|---|---|---|---|---|---|
| 0 | 2430 | 653 | 02419073 | 2430653 | Red Valley | Red Valley Chapter | T2 | D7 | G2300 | A | 922036695 | 195247 | +36.6294607 | -109.0550394 | POLYGON ((-109.2827 36.64644, -109.28181 36.65... |
| 1 | 2430 | 665 | 02419077 | 2430665 | Rock Point | Rock Point Chapter | T2 | D7 | G2300 | A | 720360268 | 88806 | +36.6598701 | -109.6166836 | POLYGON ((-109.85922 36.49859, -109.85521 36.5... |
| 2 | 2430 | 675 | 02419081 | 2430675 | Rough Rock | Rough Rock Chapter | T2 | D7 | G2300 | A | 364475668 | 216144 | +36.3976971 | -109.7695183 | POLYGON ((-109.93053 36.40672, -109.92923 36.4... |
| 3 | 2430 | 325 | 02418975 | 2430325 | Indian Wells | Indian Wells Chapter | T2 | D7 | G2300 | A | 717835323 | 133795 | +35.3248534 | -110.0855000 | POLYGON ((-110.24222 35.36327, -110.24215 35.3... |
| 4 | 2430 | 355 | 02418983 | 2430355 | Kayenta | Kayenta Chapter | T2 | D7 | G2300 | A | 1419241065 | 1982848 | +36.6884391 | -110.3045616 | POLYGON ((-110.56817 36.73489, -110.56603 36.7... |
| ... | ... | ... | ... | ... | ... | ... | ... | ... | ... | ... | ... | ... | ... | ... | ... |
| 479 | 1310 | 100 | 02418907 | 1310100 | 1 | District 1 | 28 | D7 | G2300 | N | 139902197 | 0 | +33.0600842 | -111.5806313 | POLYGON ((-111.63622 33.11798, -111.63405 33.1... |
| 480 | 4290 | 550 | 02612186 | 4290550 | Mission Highlands | Mission Highlands | 00 | D7 | G2300 | N | 6188043 | 0 | +48.0754384 | -122.2507432 | POLYGON ((-122.27579 48.07128, -122.27578 48.0... |
| 481 | 0855 | 400 | 02418941 | 0855400 | Fort Thompson | Fort Thompson District | 07 | D7 | G2300 | N | 535432708 | 38653364 | +44.1559680 | -099.4467700 | POLYGON ((-99.66452 44.25269, -99.66449 44.255... |
| 482 | 0335 | 300 | 02784108 | 0335300 | Indian Point | Indian Point Segment | T3 | D7 | G2300 | N | 326985 | 0 | +48.0604594 | -092.8466753 | POLYGON ((-92.85187 48.05944, -92.85186 48.059... |
| 483 | 5560 | 120 | 02804808 | 5560120 | Cheyenne and Arapaho District 2 | Cheyenne and Arapaho District 2 | 00 | D7 | G2300 | S | 4709525489 | 36177523 | +35.7613633 | -098.0107463 | POLYGON ((-98.61081 35.72524, -98.60732 35.725... |
484 rows × 15 columns
You might notice in this dataset that some of the names are not easily searchable. For example, the Gila River subdivisions are named “District 1-7”! So, how do we know what to search for? We recommend making an interactive plot of the data so that you can find the information you need, e.g.:
aitsn_gdf.hvplot(
geo=True, tiles='EsriImagery',
frame_width=500,
legend=False, fill_color=None, edge_color='white',
# This parameter makes all the column values in the dataset visible.
hover_cols='all')WARNING:param.main: edge_color option not found for polygons plot with bokeh; similar options include: ['muted_color', 'bgcolor', 'line_color']What column could you use to uniquely identify the subdivisions of the reservation you want to study using this interactive map? What value do you need to use to filter the GeoDataFrame?
Now that you have the info you need, it’s also a good idea to check the data type. For example, we suggest looking at the AIANNHCE column…but is that value some kind of number or an object like a text string? We can’t tell just by looking, which is where our friend the .info() method comes in:
aitsn_gdf.info()<class 'geopandas.geodataframe.GeoDataFrame'>
RangeIndex: 484 entries, 0 to 483
Data columns (total 15 columns):
# Column Non-Null Count Dtype
--- ------ -------------- -----
0 AIANNHCE 484 non-null object
1 TRSUBCE 484 non-null object
2 TRSUBNS 484 non-null object
3 GEOID 484 non-null object
4 NAME 484 non-null object
5 NAMELSAD 484 non-null object
6 LSAD 484 non-null object
7 CLASSFP 484 non-null object
8 MTFCC 484 non-null object
9 FUNCSTAT 484 non-null object
10 ALAND 484 non-null int64
11 AWATER 484 non-null int64
12 INTPTLAT 484 non-null object
13 INTPTLON 484 non-null object
14 geometry 484 non-null geometry
dtypes: geometry(1), int64(2), object(12)
memory usage: 56.8+ KBWhat is the data type of the AIANNHCE column? How will that affect your code?
Let’s go ahead and select the Gila River subdivisions, and make a site map.
- Replace
identifierwith the value you found from exploring the interactive map. Make sure that you are using the correct data type! - Change the plot to have a web tile basemap, and look the way you want it to.
# Select and merge the subdivisions you want
gdf = aitsn_gdf.loc[aitsn_gdf.AIANNHCE==identifier].dissolve()
# Plot the results with web tile images
gdf.hvplot()STEP 2: Wrangle Raster Data
Load in NDVI data
Now you need to load all the downloaded files into Python. Let’s start by getting all the file names. You will also need to extract the date from the filename. Check out the lesson on getting information from filenames in the textbook.
Instead of writing out the names of all the files you want, you can use the glob utility to find all files that match a pattern formed with the wildcard character *. The wildcard can represent any string of alphanumeric characters. For example, the pattern 'file_*.tif' will match the files 'file_1.tif', 'file_2.tiv', or even 'file_qeoiurghtfoqaegbn34pf.tif'… but it will not match 'something-else.csv' or even 'something-else.tif'.
In this notebook, we’ll use the .rglob(), or recursive glob method of the Path object instead. It works similarly, but you’ll notice that we have to convert the results to a list with the list() function.
glob doesn’t necessarily find files in the order you would expect. Make sure to sort your file names like it says in the textbook.
Take a look at the file names for the NDVI files. What do you notice is the same for all the files? Keep in mind that for this analysis you only want to import the NDVI files, not the Quality files (which would be used to identify potential incorrect measurements).
- Create a pattern for the files you want to import. Your pattern should include the parts of the file names that are the same for all files, and replace the rest with the
*character. Make sure to match the NDVI files, but not the Quality files! - Replace
ndvi-patternwith your pattern - Run the code and make sure that you are getting all the files you want and none of the files you don’t!
# Get a sorted list of NDVI tif file paths
ndvi_paths = sorted(list(project.project_dir.rglob('ndvi-pattern')))
# Display the first and last three files paths to check the pattern
ndvi_paths[:3], ndvi_paths[-3:]([PosixPath('/home/runner/.local/share/earth-analytics/gila-river-vegetation/gila-river-ndvi/MOD13Q1.061_2001137_to_2022244/MOD13Q1.061__250m_16_days_NDVI_doy2001145000000_aid0001.tif'),
PosixPath('/home/runner/.local/share/earth-analytics/gila-river-vegetation/gila-river-ndvi/MOD13Q1.061_2001137_to_2022244/MOD13Q1.061__250m_16_days_NDVI_doy2001161000000_aid0001.tif'),
PosixPath('/home/runner/.local/share/earth-analytics/gila-river-vegetation/gila-river-ndvi/MOD13Q1.061_2001137_to_2022244/MOD13Q1.061__250m_16_days_NDVI_doy2001177000000_aid0001.tif')],
[PosixPath('/home/runner/.local/share/earth-analytics/gila-river-vegetation/gila-river-ndvi/MOD13Q1.061_2001137_to_2022244/MOD13Q1.061__250m_16_days_NDVI_doy2022209000000_aid0001.tif'),
PosixPath('/home/runner/.local/share/earth-analytics/gila-river-vegetation/gila-river-ndvi/MOD13Q1.061_2001137_to_2022244/MOD13Q1.061__250m_16_days_NDVI_doy2022225000000_aid0001.tif'),
PosixPath('/home/runner/.local/share/earth-analytics/gila-river-vegetation/gila-river-ndvi/MOD13Q1.061_2001137_to_2022244/MOD13Q1.061__250m_16_days_NDVI_doy2022241000000_aid0001.tif')])Repeating tasks in Python
Now you should have a few dozen files! For each file, you need to:
- Load the file in using the
rioxarraylibrary - Get the date from the file name
- Add the date as a dimension coordinate
- Give your data variable a name
You don’t want to write out the code for each file! That’s a recipe for copy pasta. Luckily, Python has tools for doing similar tasks repeatedly. In this case, you’ll use one called a for loop.
There’s some code below that uses a for loop in what is called an accumulation pattern to process each file. That means that you will save the results of your processing to a list each time you process the files, and then merge all the arrays in the list.
- Look at the file names. How many characters from the end is the date?
doy_startanddoy_endare used to extract the day of the year (doy) from the file name. You will need to count characters from the end and change the values to get the right part of the file name. HINT: the index -1 in Python means the last value, -2 second-to-last, and so on. - Replace any required variable names with your chosen variable names
doy_start = -1
doy_end = -1
# Loop through each NDVI image
ndvi_das = []
for ndvi_path in ndvi_paths:
# Get date from file name
# Open dataset
# Add date dimension and clean up metadata
da = da.assign_coords({'date': date})
da = da.expand_dims({'date': 1})
da.name = 'NDVI'
# Prepare for concatenation154Combine Rasters
Next, stack your arrays by date into a time series using the xr.combine_by_coords() function. You will have to tell it which dimension you want to stack your data in.
# Combine NDVI images from all dates/tmp/ipykernel_3243/3809486676.py:2: FutureWarning: In a future version of xarray the default value for compat will change from compat='no_conflicts' to compat='override'. This is likely to lead to different results when combining overlapping variables with the same name. To opt in to new defaults and get rid of these warnings now use `set_options(use_new_combine_kwarg_defaults=True) or set compat explicitly.
ndvi_da = xr.combine_by_coords(ndvi_das, coords=['date'])
/tmp/ipykernel_3243/3809486676.py:2: FutureWarning: In a future version of xarray the default value for compat will change from compat='no_conflicts' to compat='override'. This is likely to lead to different results when combining overlapping variables with the same name. To opt in to new defaults and get rid of these warnings now use `set_options(use_new_combine_kwarg_defaults=True) or set compat explicitly.
ndvi_da = xr.combine_by_coords(ndvi_das, coords=['date'])<xarray.Dataset> Size: 48MB
Dimensions: (date: 154, y: 203, x: 382)
Coordinates:
* date (date) datetime64[ns] 1kB 2001-01-14 2001-01-16 ... 2022-01-24
* y (y) float64 2kB 33.39 33.39 33.38 33.38 ... 32.97 32.97 32.97
* x (x) float64 3kB -112.3 -112.3 -112.3 ... -111.5 -111.5 -111.5
band int64 8B 1
spatial_ref int64 8B 0
Data variables:
NDVI (date, y, x) float32 48MB 0.8282 0.6146 ... 0.2146 0.2085STEP 3: Plot NDVI
Complete the following:
- Select data from before the water rights case (2001 to 2012)
- Take the temporal mean (over the date, not spatially)
- Get the NDVI variable (should be a DataArray, not a Dataset)
- Repeat for the data from after the water rights case (2012 to 2022)
- Subtract the pre-event data from the post-event data
- Plot the result using a diverging color map like
cmap=plt.cm.PiYG
There are different types of color maps for different types of data. In this case, we want decreases to be a different color from increases, so we should use a diverging color map. Check out available colormaps in the matplotlib documentation.
For an extra challenge, add the Gila River Indian Community boundary to the plot.
# Compute the difference in NDVI before and after
# Plot the difference
(
ndvi_diff.hvplot(x='', y='', cmap='', geo=True)
*
gdf.hvplot(geo=True, fill_color=None, line_color='black')
)STEP 4: Is the NDVI different within the Gila River Indian Community after the water rights case?
You will compute the mean NDVI inside and outside the fire boundary. First, use the code below to get a GeoDataFrame of the area outside the Reservation.
- Check the variable names - Make sure that the code uses your boundary
GeoDataFrame - How could you test if the geometry was modified correctly? Add some code to take a look at the results.
# Compute the area outside the fire boundaryNext, clip your DataArray to the boundaries for both inside and outside the reservation. You will need to replace the GeoDataFrame name with your own. Check out the lesson on clipping data with the rioxarray library in the textbook.
It’s important to use from_disk=True when clipping large arrays like this. It allows the computer to use less valuable memory resources when clipping - you will probably find that otherwise the cell below crashes your kernel.
# Clip data to both inside and outside the boundaryFor both inside and outside the Gila River Indian Community boundary:
- Group the data by year
- Take the mean. You always need to tell reducing methods in
xarraywhat dimensions you want to reduce. When you want to summarize data across all dimensions, you can use the...syntax, e.g..mean(...)as a shorthand. - Select the NDVI variable
- Convert to a DataFrame using the
to_dataframe()method - Join the two DataFrames for plotting using the
.join()method. You will need to rename the columns using thelsuffix=andrsuffix=parameters
Finally, plot annual July means for both inside and outside the Reservation on the same plot.
The DateIndex in pandas is a little different from the Datetime Dimension in xarray. You will need to use the .dt.year syntax to access information about the year, not just .year.
# Compute mean annual July NDVINow, take the difference between outside and inside the site boundary and plot that. What do you observe? Don’t forget to write a headline and description of your plot!
# Plot difference inside and outside the boundary