Harmonizing Open Datasets: Daily Temperature and Ozone Analysis
Author
Min Gon Chung
Published
March 21, 2025
This lesson demonstrates a workflow for harmonizing daily ozone observations from AirNow with daily maximum temperature data from Daymet for an urban study area.
Setup
# Import packages for: # file handling, Earthdata access, spatial data, data manipulation,# date operations, netCDF, and plotting.import calendar # Determine month lengthsimport datetime # Date operationsimport earthaccess # Access NASA Earthdataimport earthpy # Manage local data directoriesimport geopandas as gpd # Spatial vector data processingimport pandas as pd # Data manipulationimport matplotlib.pyplot as plt # Plottingimport xarray as xr # netCDF dataset handlingfrom tqdm.notebook import tqdm # Display progress bars# Global parameters (used for both ozone and temperature data)year =2018month =7
Download and process the urban shapefile for the study area
# Define the URL of the urban shapefile (zip file) from the US Censusurl_shp = ("https://www2.census.gov/geo/tiger/GENZ2016/shp/cb_2016_us_ua10_500k.zip")# Read the shapefile directly into a GeoDataFramegdf = gpd.read_file(url_shp)gdf.info()
ERROR 1: PROJ: proj_create_from_database: Open of /usr/share/miniconda/envs/learning-portal/share/proj failed
# Select a specific urban area by name (e.g., "Denver--Aurora, CO")city = ( gdf[ gdf["NAME10"].str.contains("Denver--Aurora, CO", case=False, na=False) ])print("Selected urban area (Denver):")display(city)# If the shapefile is not in WGS84 (EPSG:4326), reproject itprint(f"Original CRS: {city.crs}")if city.crs !="EPSG:4326": city = city.to_crs("EPSG:4326")print("Reprojected to WGS84 (EPSG:4326).")
Selected urban area (Denver):
UACE10
AFFGEOID10
GEOID10
NAME10
LSAD10
UATYP10
ALAND10
AWATER10
geometry
492
23527
400C100US23527
23527
Denver--Aurora, CO
75
U
1729188957
35340642
MULTIPOLYGON (((-104.71571 39.5216, -104.7154 ...
Original CRS: EPSG:4269
Reprojected to WGS84 (EPSG:4326).
# Display available columns to inspect attributesprint("Columns in the shapefile:")city.info()
# Extract the bounding box of Denver using total_bounds # ([minx, miny, maxx, maxy])ifnot city.empty: minx, miny, maxx, maxy = city.total_bounds# Define bounding box with keys: north, west, east, south bbox = {"north": maxy, "west": minx, "east": maxx, "south": miny}print("Bounding box for City:") display(bbox)else:print("Polygon not found in the dataset.")
# Define a function to standardize a daily ozone DataFramedef standardize_df(df): std_cols = ["Valid_date", "AQSID", "Parameter_Name", "Value", "Latitude", "Longitude", "AQI", "AQI_Category" ]if df.shape[1] ==13: df.columns = ["Valid_date", "AQSID", "Site_Name", "Parameter_Name", "Reporting_Units", "Value", "Averaging_Period", "Data_Source", "AQI", "AQI_Category","Latitude", "Longitude", "Full_AQSID" ]return df[std_cols]elif df.shape[1] ==8: df.columns = ["Valid_date", "AQSID", "Site_Name", "Parameter_Name", "Reporting_Units", "Value", "AQI", "AQI_Category" ] df["Latitude"] = pd.NA df["Longitude"] = pd.NAreturn df[std_cols]else:returnNone# Create a list of dates for the given month and yeardates = [ datetime.date(year, month, d) for d inrange(1, calendar.monthrange(year, month)[1]+1)]# Initialize a list to store standardized daily ozone DataFramesaq_list = []aq_errors = []# Loop through each date and download the corresponding daily ozone dataozone_progress = tqdm(dates, desc="Downloading ozone data", unit="day")for d in ozone_progress: ozone_progress.set_postfix_str(d.isoformat()) date_str = d.strftime("%Y%m%d") url_aq = ("https://s3-us-west-1.amazonaws.com/files.airnowtech.org/airnow/"f"{year}/{date_str}/daily_data.dat" )try: ozone_path = project.data.get_data( url=url_aq, filename=f"airnow-ozone/daily_data_{date_str}.dat" )if ozone_path.exists(): df = pd.read_csv(ozone_path, sep="|", header=None) std_df = standardize_df(df)if std_df isnotNone: aq_list.append(std_df)else: aq_errors.append((d, "Unexpected column count"))exceptExceptionas e: aq_errors.append((d, str(e)))if aq_errors: pd.DataFrame(aq_errors, columns=["date", "error"])else:f"Downloaded ozone data for {len(aq_list)} days"# Combine all daily data into a single DataFrameaq_df = pd.concat(aq_list, ignore_index=True)# Filter for "OZONE-8HR" records (or adjust as needed)aq_df = aq_df[aq_df["Parameter_Name"] =="OZONE-8HR"]# Convert the date column to datetime formataq_df["Valid_date"] = pd.to_datetime(aq_df["Valid_date"], format="%m/%d/%y")aq_df
Downloading from https://s3-us-west-1.amazonaws.com/files.airnowtech.org/airnow/2018/20180701/daily_data.dat
Downloading from https://s3-us-west-1.amazonaws.com/files.airnowtech.org/airnow/2018/20180702/daily_data.dat
Downloading from https://s3-us-west-1.amazonaws.com/files.airnowtech.org/airnow/2018/20180703/daily_data.dat
Downloading from https://s3-us-west-1.amazonaws.com/files.airnowtech.org/airnow/2018/20180704/daily_data.dat
Downloading from https://s3-us-west-1.amazonaws.com/files.airnowtech.org/airnow/2018/20180705/daily_data.dat
Downloading from https://s3-us-west-1.amazonaws.com/files.airnowtech.org/airnow/2018/20180706/daily_data.dat
Downloading from https://s3-us-west-1.amazonaws.com/files.airnowtech.org/airnow/2018/20180707/daily_data.dat
Downloading from https://s3-us-west-1.amazonaws.com/files.airnowtech.org/airnow/2018/20180708/daily_data.dat
Downloading from https://s3-us-west-1.amazonaws.com/files.airnowtech.org/airnow/2018/20180709/daily_data.dat
Downloading from https://s3-us-west-1.amazonaws.com/files.airnowtech.org/airnow/2018/20180710/daily_data.dat
Downloading from https://s3-us-west-1.amazonaws.com/files.airnowtech.org/airnow/2018/20180711/daily_data.dat
Downloading from https://s3-us-west-1.amazonaws.com/files.airnowtech.org/airnow/2018/20180712/daily_data.dat
Downloading from https://s3-us-west-1.amazonaws.com/files.airnowtech.org/airnow/2018/20180713/daily_data.dat
Downloading from https://s3-us-west-1.amazonaws.com/files.airnowtech.org/airnow/2018/20180714/daily_data.dat
Downloading from https://s3-us-west-1.amazonaws.com/files.airnowtech.org/airnow/2018/20180715/daily_data.dat
Downloading from https://s3-us-west-1.amazonaws.com/files.airnowtech.org/airnow/2018/20180716/daily_data.dat
Downloading from https://s3-us-west-1.amazonaws.com/files.airnowtech.org/airnow/2018/20180717/daily_data.dat
Downloading from https://s3-us-west-1.amazonaws.com/files.airnowtech.org/airnow/2018/20180718/daily_data.dat
Downloading from https://s3-us-west-1.amazonaws.com/files.airnowtech.org/airnow/2018/20180719/daily_data.dat
Downloading from https://s3-us-west-1.amazonaws.com/files.airnowtech.org/airnow/2018/20180720/daily_data.dat
Downloading from https://s3-us-west-1.amazonaws.com/files.airnowtech.org/airnow/2018/20180721/daily_data.dat
Downloading from https://s3-us-west-1.amazonaws.com/files.airnowtech.org/airnow/2018/20180722/daily_data.dat
Downloading from https://s3-us-west-1.amazonaws.com/files.airnowtech.org/airnow/2018/20180723/daily_data.dat
Downloading from https://s3-us-west-1.amazonaws.com/files.airnowtech.org/airnow/2018/20180724/daily_data.dat
Downloading from https://s3-us-west-1.amazonaws.com/files.airnowtech.org/airnow/2018/20180725/daily_data.dat
Downloading from https://s3-us-west-1.amazonaws.com/files.airnowtech.org/airnow/2018/20180726/daily_data.dat
Downloading from https://s3-us-west-1.amazonaws.com/files.airnowtech.org/airnow/2018/20180727/daily_data.dat
Downloading from https://s3-us-west-1.amazonaws.com/files.airnowtech.org/airnow/2018/20180728/daily_data.dat
Downloading from https://s3-us-west-1.amazonaws.com/files.airnowtech.org/airnow/2018/20180729/daily_data.dat
Downloading from https://s3-us-west-1.amazonaws.com/files.airnowtech.org/airnow/2018/20180730/daily_data.dat
Downloading from https://s3-us-west-1.amazonaws.com/files.airnowtech.org/airnow/2018/20180731/daily_data.dat
Valid_date
AQSID
Parameter_Name
Value
Latitude
Longitude
AQI
AQI_Category
1
2018-07-11
000010102
OZONE-8HR
22.0
<NA>
<NA>
8
Newfoundland & Labrador DEC
3
2018-07-11
000010401
OZONE-8HR
22.0
<NA>
<NA>
8
Newfoundland & Labrador DEC
6
2018-07-11
000010601
OZONE-8HR
23.0
<NA>
<NA>
8
Canadian Air and Precipitation Monitoring Network
8
2018-07-11
000010801
OZONE-8HR
25.0
<NA>
<NA>
8
Newfoundland & Labrador DEC
10
2018-07-11
000020104
OZONE-8HR
20.0
<NA>
<NA>
8
Environment Canada
...
...
...
...
...
...
...
...
...
100932
2018-07-31
MNA010001
OZONE-8HR
75.0
<NA>
<NA>
8
U.S. Department of State Bahrain - Manama
100948
2018-07-31
TT0300001
OZONE-8HR
48.0
<NA>
<NA>
8
Wampanoag Tribe
100950
2018-07-31
TT0328801
OZONE-8HR
30.0
<NA>
<NA>
8
Catawba Indian Nation
100954
2018-07-31
TT5420500
OZONE-8HR
61.0
<NA>
<NA>
8
Tachi-Yokut Tribe
100957
2018-07-31
TT9209004
OZONE-8HR
50.0
<NA>
<NA>
8
Quapaw Tribe
27540 rows × 8 columns
# Define column names for monitoring station data as provided.col_names = ["AQSID", "parametername", "sitecode", "sitename", "status", "agencyid","agencyname", "EPAregion", "latitude", "longitude", "elevation", "GMToffset", "countrycode", "MSAcode", "MSAname", "statecode", "statename", "countycode", "countyname"]# Initialize a list to store daily monitoring station DataFrames.monitor_list = []monitor_errors = []# Loop through each date to download monitoring station location data.monitor_progress = tqdm(dates, desc="Downloading station data", unit="day")for d in monitor_progress: monitor_progress.set_postfix_str(d.isoformat()) date_str = d.strftime("%Y%m%d") # Format the date as yyyymmdd. url_mon = ("https://s3-us-west-1.amazonaws.com/files.airnowtech.org/airnow"f"/{year}/{date_str}/monitoring_site_locations.dat" )try: monitor_path = project.data.get_data( url=url_mon, filename=("airnow-monitoring-sites/"f"monitoring_site_locations_{date_str}.dat" ) )if monitor_path.exists():# Read the file without a header. df_mon = pd.read_csv( monitor_path, sep="|", header=None, encoding="latin1", )# Select only the columns for AQSID (column 0), # latitude (column 8), and longitude (column 9) df_mon = df_mon[[0, 8, 9]]# Rename these columns. df_mon.columns = ["AQSID", "latitude", "longitude"] monitor_list.append(df_mon)exceptExceptionas e: monitor_errors.append((d, str(e)))if monitor_errors: pd.DataFrame(monitor_errors, columns=["date", "error"])else:f"Downloaded monitoring station data for {len(monitor_list)} days"ifnot monitor_list:raiseRuntimeError("No monitoring station data files were processed. ""Review monitor_errors for download or parsing failures." )# Combine all daily monitoring station data.monitor_df = pd.concat(monitor_list, ignore_index=True)# Remove duplicate AQSID rows, keeping the first occurrence.monitor_df = monitor_df.drop_duplicates(subset=["AQSID"], keep="first")print("Processed monitoring station locations:")monitor_df.head()
Downloading from https://s3-us-west-1.amazonaws.com/files.airnowtech.org/airnow/2018/20180701/monitoring_site_locations.dat
Downloading from https://s3-us-west-1.amazonaws.com/files.airnowtech.org/airnow/2018/20180702/monitoring_site_locations.dat
Downloading from https://s3-us-west-1.amazonaws.com/files.airnowtech.org/airnow/2018/20180703/monitoring_site_locations.dat
Downloading from https://s3-us-west-1.amazonaws.com/files.airnowtech.org/airnow/2018/20180704/monitoring_site_locations.dat
Downloading from https://s3-us-west-1.amazonaws.com/files.airnowtech.org/airnow/2018/20180705/monitoring_site_locations.dat
Downloading from https://s3-us-west-1.amazonaws.com/files.airnowtech.org/airnow/2018/20180706/monitoring_site_locations.dat
Downloading from https://s3-us-west-1.amazonaws.com/files.airnowtech.org/airnow/2018/20180707/monitoring_site_locations.dat
Downloading from https://s3-us-west-1.amazonaws.com/files.airnowtech.org/airnow/2018/20180708/monitoring_site_locations.dat
Downloading from https://s3-us-west-1.amazonaws.com/files.airnowtech.org/airnow/2018/20180709/monitoring_site_locations.dat
Downloading from https://s3-us-west-1.amazonaws.com/files.airnowtech.org/airnow/2018/20180710/monitoring_site_locations.dat
Downloading from https://s3-us-west-1.amazonaws.com/files.airnowtech.org/airnow/2018/20180711/monitoring_site_locations.dat
Downloading from https://s3-us-west-1.amazonaws.com/files.airnowtech.org/airnow/2018/20180712/monitoring_site_locations.dat
Downloading from https://s3-us-west-1.amazonaws.com/files.airnowtech.org/airnow/2018/20180713/monitoring_site_locations.dat
Downloading from https://s3-us-west-1.amazonaws.com/files.airnowtech.org/airnow/2018/20180714/monitoring_site_locations.dat
Downloading from https://s3-us-west-1.amazonaws.com/files.airnowtech.org/airnow/2018/20180715/monitoring_site_locations.dat
Downloading from https://s3-us-west-1.amazonaws.com/files.airnowtech.org/airnow/2018/20180716/monitoring_site_locations.dat
Downloading from https://s3-us-west-1.amazonaws.com/files.airnowtech.org/airnow/2018/20180717/monitoring_site_locations.dat
Downloading from https://s3-us-west-1.amazonaws.com/files.airnowtech.org/airnow/2018/20180718/monitoring_site_locations.dat
Downloading from https://s3-us-west-1.amazonaws.com/files.airnowtech.org/airnow/2018/20180719/monitoring_site_locations.dat
Downloading from https://s3-us-west-1.amazonaws.com/files.airnowtech.org/airnow/2018/20180720/monitoring_site_locations.dat
Downloading from https://s3-us-west-1.amazonaws.com/files.airnowtech.org/airnow/2018/20180721/monitoring_site_locations.dat
Downloading from https://s3-us-west-1.amazonaws.com/files.airnowtech.org/airnow/2018/20180722/monitoring_site_locations.dat
Downloading from https://s3-us-west-1.amazonaws.com/files.airnowtech.org/airnow/2018/20180723/monitoring_site_locations.dat
Downloading from https://s3-us-west-1.amazonaws.com/files.airnowtech.org/airnow/2018/20180724/monitoring_site_locations.dat
Downloading from https://s3-us-west-1.amazonaws.com/files.airnowtech.org/airnow/2018/20180725/monitoring_site_locations.dat
Downloading from https://s3-us-west-1.amazonaws.com/files.airnowtech.org/airnow/2018/20180726/monitoring_site_locations.dat
Downloading from https://s3-us-west-1.amazonaws.com/files.airnowtech.org/airnow/2018/20180727/monitoring_site_locations.dat
Downloading from https://s3-us-west-1.amazonaws.com/files.airnowtech.org/airnow/2018/20180728/monitoring_site_locations.dat
Downloading from https://s3-us-west-1.amazonaws.com/files.airnowtech.org/airnow/2018/20180729/monitoring_site_locations.dat
Downloading from https://s3-us-west-1.amazonaws.com/files.airnowtech.org/airnow/2018/20180730/monitoring_site_locations.dat
Downloading from https://s3-us-west-1.amazonaws.com/files.airnowtech.org/airnow/2018/20180731/monitoring_site_locations.dat
Processed monitoring station locations:
AQSID
latitude
longitude
0
000020301
46.4783
-63.9869
4
000030118
44.6478
-63.5722
6
000030501
44.4336
-65.2058
7
000040701
45.6425
-65.7028
8
000040501
45.0750
-66.4664
Merge monitoring station data with ozone data
# Merge the monitoring data with AQ data on AQSID.aq_df = pd.merge( aq_df, monitor_df, on="AQSID", how="left", suffixes=("", "_mon"))# Fill missing Latitude/Longitude in aq_df using monitoring data.aq_df["Latitude"] = aq_df["Latitude"].fillna(aq_df["latitude"])aq_df["Longitude"] = aq_df["Longitude"].fillna(aq_df["longitude"])# Drop extra columns.aq_df = aq_df.drop(columns=["latitude", "longitude"])print("Merged AQ data with monitoring locations.")aq_df
Merged AQ data with monitoring locations.
Valid_date
AQSID
Parameter_Name
Value
Latitude
Longitude
AQI
AQI_Category
0
2018-07-11
000010102
OZONE-8HR
22.0
47.6528
-52.8167
8
Newfoundland & Labrador DEC
1
2018-07-11
000010401
OZONE-8HR
22.0
47.505
-52.7947
8
Newfoundland & Labrador DEC
2
2018-07-11
000010601
OZONE-8HR
23.0
53.3047
-60.3644
8
Canadian Air and Precipitation Monitoring Network
3
2018-07-11
000010801
OZONE-8HR
25.0
50.71124
-57.36365
8
Newfoundland & Labrador DEC
4
2018-07-11
000020104
OZONE-8HR
20.0
46.2406
-63.1306
8
Environment Canada
...
...
...
...
...
...
...
...
...
27535
2018-07-31
MNA010001
OZONE-8HR
75.0
26.204697
50.570833
8
U.S. Department of State Bahrain - Manama
27536
2018-07-31
TT0300001
OZONE-8HR
48.0
41.330601
-70.788896
8
Wampanoag Tribe
27537
2018-07-31
TT0328801
OZONE-8HR
30.0
34.91263
-80.874283
8
Catawba Indian Nation
27538
2018-07-31
TT5420500
OZONE-8HR
61.0
36.233333
-119.765083
8
Tachi-Yokut Tribe
27539
2018-07-31
TT9209004
OZONE-8HR
50.0
36.922222
-94.83889
8
Quapaw Tribe
27540 rows × 8 columns
# If latitude/longitude are available, subset by the urban bounding boxaq_df = aq_df[(aq_df["Latitude"].astype(float) >= bbox["south"]) & (aq_df["Latitude"].astype(float) <= bbox["north"]) & (aq_df["Longitude"].astype(float) >= bbox["west"]) & (aq_df["Longitude"].astype(float) <= bbox["east"])]daily_aq = ( aq_df .groupby("Valid_date")["Value"] .mean() .reset_index() .rename(columns={"Value": "Avg_AQ"}))# Display the first few rows of the daily average AQ data.daily_aq.head()
Valid_date
Avg_AQ
0
2018-07-11
68.000000
1
2018-07-12
61.000000
2
2018-07-13
67.428571
3
2018-07-14
74.571429
4
2018-07-15
35.571429
Download and process daily maximum temperature data from Daymet
# Determine the last day of the month.last_day = calendar.monthrange(year, month)[1]# Use "tmax" as the climate variableclimate_var ="tmax"start_date = datetime.date(year, month, 1)end_date = datetime.date(year, month, last_day)earthaccess.login(persist=True)daymet_results = earthaccess.search_data( short_name="Daymet_Daily_V4R1_2129", provider="ORNL_CLOUD", temporal=(start_date.isoformat(), end_date.isoformat()), count=20,)daymet_granule = [ resultfor result in daymet_resultsiff"_na_{climate_var}_{year}.nc"in result.data_links()[0]][0]daymet_file = earthaccess.open([daymet_granule])[0]ds = xr.open_dataset( daymet_file, engine="h5netcdf", chunks={},)ds
/usr/share/miniconda/envs/learning-portal/lib/python3.11/site-packages/earthaccess/results.py:343: FutureWarning: As of version 1.0, `DataGranule.size` will be accessed as an attribute; e.g. use `DataCollection.size` **not** `DataCollection.size()`
  self["size"] = self.size()
/usr/share/miniconda/envs/learning-portal/lib/python3.11/site-packages/earthaccess/store.py:516: FutureWarning: As of version 1.0, `DataGranule.size` will be accessed as an attribute; e.g. use `DataCollection.size` **not** `DataCollection.size()`
  total_size = round(sum([granule.size() for granule in granules]) / 1024, 2)
<xarray.Dataset> Size: 93GB
Dimensions:                  (time: 365, nv: 2, y: 8075, x: 7814)
Coordinates:
  * time                     (time) datetime64[ns] 3kB 2018-01-01T12:00:00 .....
  * y                        (y) float32 32kB 4.984e+06 4.983e+06 ... -3.09e+06
  * x                        (x) float32 31kB -4.56e+06 -4.559e+06 ... 3.253e+06
    lat                      (y, x) float32 252MB dask.array<chunksize=(1010, 977), meta=np.ndarray>
    lon                      (y, x) float32 252MB dask.array<chunksize=(1010, 977), meta=np.ndarray>
Dimensions without coordinates: nv
Data variables:
    yearday                  (time) int16 730B dask.array<chunksize=(1,), meta=np.ndarray>
    time_bnds                (time, nv) datetime64[ns] 6kB dask.array<chunksize=(1, 2), meta=np.ndarray>
    lambert_conformal_conic  int16 2B ...
    tmax                     (time, y, x) float32 92GB dask.array<chunksize=(1, 1000, 1000), meta=np.ndarray>
Attributes:
    start_year:        2018
    source:            Daymet Software Version 4.0
    Version_software:  Daymet Software Version 4.0
    Version_data:      Daymet Data Version 4.0
    Conventions:       CF-1.6
    citation:          Please see http://daymet.ornl.gov/ for current Daymet ...
    references:        Please see http://daymet.ornl.gov/ for current informa...
Please see http://daymet.ornl.gov/ for current Daymet data citation information
references :
Please see http://daymet.ornl.gov/ for current information on Daymet references
# Compute the daily average of the climate variable over the spatial domain.daymet_crs = {"proj": "lcc","lat_1": 25,"lat_2": 60,"lat_0": 42.5,"lon_0": -100,"x_0": 0,"y_0": 0,"datum": "WGS84","units": "m",}minx, miny, maxx, maxy = city.to_crs(daymet_crs).total_boundsds_denver = ds.sel( time=slice(start_date.isoformat(), end_date.isoformat()), x=slice(minx, maxx), y=slice(maxy, miny),)daily_climate = ( ds_denver[climate_var].mean(dim=["x", "y"]).to_dataframe().reset_index() .assign(time=lambda df: df["time"].dt.floor("D")))display(daily_climate)# Convert the time coordinate to datetime and rename columns.daily_climate["time"] = pd.to_datetime(daily_climate["time"])daily_climate = daily_climate.rename( columns={climate_var: "Avg_Climate", "time": "Valid_date"})daily_climate
time
tmax
0
2018-07-01
30.535051
1
2018-07-02
34.059193
2
2018-07-03
34.681599
3
2018-07-04
32.843704
4
2018-07-05
28.970442
5
2018-07-06
31.763699
6
2018-07-07
35.443626
7
2018-07-08
34.749596
8
2018-07-09
33.697033
9
2018-07-10
35.242657
10
2018-07-11
34.066265
11
2018-07-12
30.116076
12
2018-07-13
30.904976
13
2018-07-14
34.493370
14
2018-07-15
23.074739
15
2018-07-16
30.641472
16
2018-07-17
30.235378
17
2018-07-18
34.070011
18
2018-07-19
35.660931
19
2018-07-20
34.637867
20
2018-07-21
34.616325
21
2018-07-22
33.660103
22
2018-07-23
25.583172
23
2018-07-24
30.449577
24
2018-07-25
27.720482
25
2018-07-26
26.888582
26
2018-07-27
27.430410
27
2018-07-28
25.697252
28
2018-07-29
25.620207
29
2018-07-30
24.685444
30
2018-07-31
29.204075
Valid_date
Avg_Climate
0
2018-07-01
30.535051
1
2018-07-02
34.059193
2
2018-07-03
34.681599
3
2018-07-04
32.843704
4
2018-07-05
28.970442
5
2018-07-06
31.763699
6
2018-07-07
35.443626
7
2018-07-08
34.749596
8
2018-07-09
33.697033
9
2018-07-10
35.242657
10
2018-07-11
34.066265
11
2018-07-12
30.116076
12
2018-07-13
30.904976
13
2018-07-14
34.493370
14
2018-07-15
23.074739
15
2018-07-16
30.641472
16
2018-07-17
30.235378
17
2018-07-18
34.070011
18
2018-07-19
35.660931
19
2018-07-20
34.637867
20
2018-07-21
34.616325
21
2018-07-22
33.660103
22
2018-07-23
25.583172
23
2018-07-24
30.449577
24
2018-07-25
27.720482
25
2018-07-26
26.888582
26
2018-07-27
27.430410
27
2018-07-28
25.697252
28
2018-07-29
25.620207
29
2018-07-30
24.685444
30
2018-07-31
29.204075
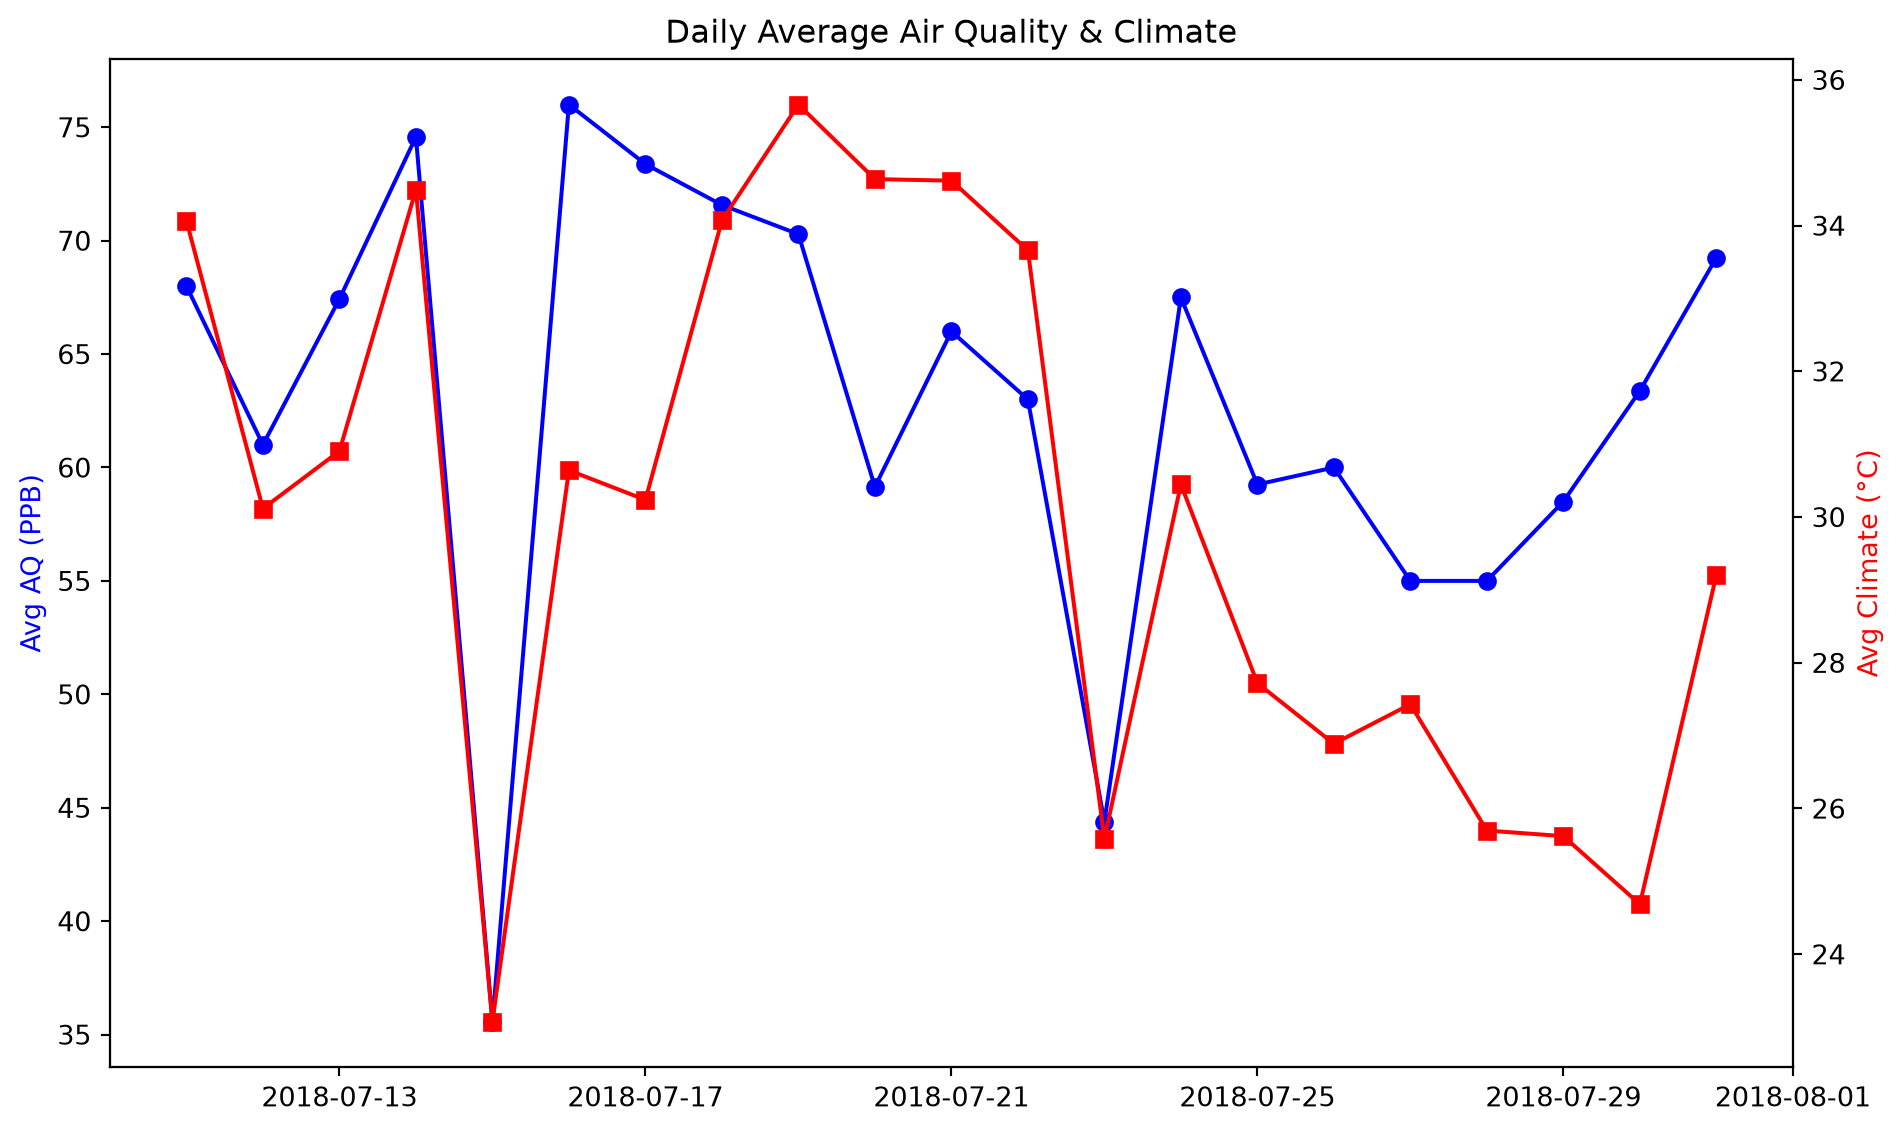
# Merge the daily AQ and climate data on the Valid_date column.combined = pd.merge(daily_aq, daily_climate, on="Valid_date", how="inner")combined
Valid_date
Avg_AQ
Avg_Climate
0
2018-07-11
68.000000
34.066265
1
2018-07-12
61.000000
30.116076
2
2018-07-13
67.428571
30.904976
3
2018-07-14
74.571429
34.493370
4
2018-07-15
35.571429
23.074739
5
2018-07-16
76.000000
30.641472
6
2018-07-17
73.375000
30.235378
7
2018-07-18
71.571429
34.070011
8
2018-07-19
70.285714
35.660931
9
2018-07-20
59.142857
34.637867
10
2018-07-21
66.000000
34.616325
11
2018-07-22
63.000000
33.660103
12
2018-07-23
44.375000
25.583172
13
2018-07-24
67.500000
30.449577
14
2018-07-25
59.250000
27.720482
15
2018-07-26
60.000000
26.888582
16
2018-07-27
55.000000
27.430410
17
2018-07-28
55.000000
25.697252
18
2018-07-29
58.500000
25.620207
19
2018-07-30
63.375000
24.685444
20
2018-07-31
69.250000
29.204075
Plot the daily average AQ and climate data
# Create a dual-axis plot for daily AQ and climate data.fig, ax1 = plt.subplots(figsize=(10,6))# Plot the daily average AQ data on the primary y-axis (left).ax1.plot( combined["Valid_date"], combined["Avg_AQ"], "o-", color="blue", label="Avg AQ")ax1.set_ylabel("Avg AQ (PPB)", color="blue")# Create a secondary y-axis (right) and plot the daily average climate data.ax2 = ax1.twinx()ax2.plot( combined["Valid_date"], combined["Avg_Climate"], "s-", color="red", label="Avg Climate")ax2.set_ylabel("Avg Climate (°C)", color="red")# Add a title and adjust layoutplt.title("Daily Average Air Quality & Climate")plt.tight_layout()plt.show()