Calculating slope and aspect from a digital elevation model in Python
Digital elevation models (DEM) provide a representaion of surface topography (elevation) in two dimensional space. DEMs are a 3D representaion of a terrain’s surface such as the Earth. Typically, DEM data can be represented as a raster which is most easily expressed as being a 2D array with each individual cell having an elevation associated with it.
With a DEM, you can analyze certain derived quantities using prebuild software. This tutorial will go over how to compute the slope and aspect of an area using DEM data.
Objectives
- Read in DEM data
- Compute the slope for the entirety of the data
- Compute the aspect for the entirety of the data
- Plot the slope of the terrain
- Plot the aspect of the terrain
Dependencies
- numpy
- matplotlib
- elevation
- richdem
import os
import numpy as np
import matplotlib
import matplotlib.pyplot as plt
import elevation
import richdem as rd
matplotlib.rcParams['figure.figsize'] = (8, 5.5)
Download a digital elevation model
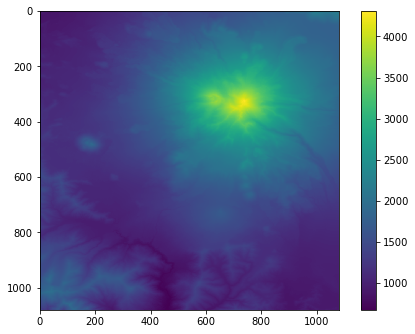
The elevation module provides access to elevation data from the NASA SRTM mission, with areas of interest specified via a bounding box. Here you draw a bounding box around Mt. Shasta in northern California, and use the clip funciton to output a GeoTIFF.
dem_path = os.path.join(os.getcwd(), 'Shasta-30m-DEM.tif')
elevation.clip(bounds=(-122.4, 41.2, -122.1, 41.5), output=dem_path)
Load the DEM with richdem
The richdem package has a LoadGDAL function for loading DEMs that you can use here.
shasta_dem = rd.LoadGDAL(dem_path)
plt.imshow(shasta_dem, interpolation='none')
plt.colorbar()
plt.show()

Compute and plot slope and aspect
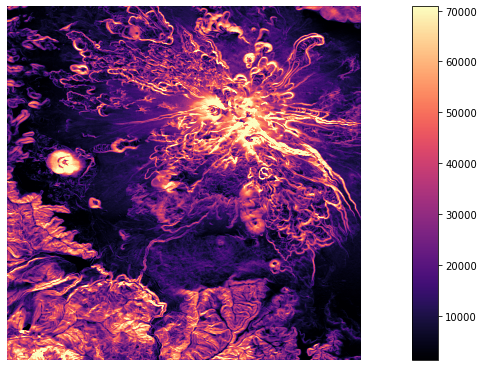
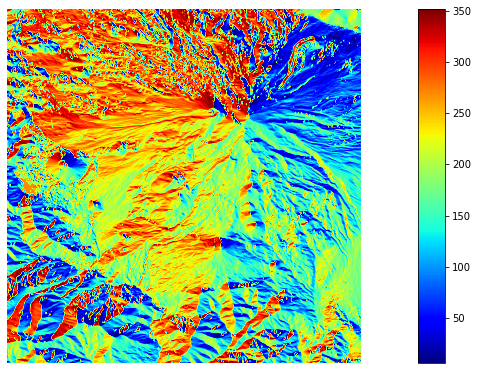
You can use the rd.TerrainAttribute function to compute slope and aspect for each pixel. Note that there are multiple ways to represent the slope values. Read the richdem docs for more options.
To visualize slope and aspect, you can use the rdShow function.
slope = rd.TerrainAttribute(shasta_dem, attrib='slope_riserun')
rd.rdShow(slope, axes=False, cmap='magma', figsize=(8, 5.5))
plt.show()

aspect = rd.TerrainAttribute(shasta_dem, attrib='aspect')
rd.rdShow(aspect, axes=False, cmap='jet', figsize=(8, 5.5))
plt.show()

Share on
Twitter Facebook Google+ LinkedIn
Leave a Comment