Lesson 2. Introduction to Lidar Point Cloud Data - Active Remote Sensing
Learning Objectives
After completing this tutorial, you will be able to:
- List 4 common attributes of each point in a lidar point cloud.
- Briefly describe how a lidar system collects lidar points.
- Be able to describe the difference between how a discrete and full waveform lidar system collect data.
What You Need
You will need a computer with internet access to complete this lesson.
If you have not already downloaded the week 3 data, please do so now. Download Week 3 Data (~250 MB)
In the last lesson, you learned the basics of how a lidar system works. In this lesson, you will learn about lidar point clouds. The point cloud is one of the commonly found lidar data products and is the “native” format for discrete return lidar data. In this lesson you will explore some point cloud data using the plas.io viewer.
Explore Lidar Points in plas.io
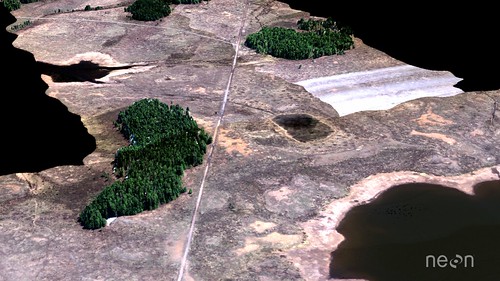
In this activity, you will open a .las file, in the
plas.io free online lidar data viewer. You will then explore some of the attributes
associated with a lidar data point cloud.
Lidar Attribute Data
Remember that not all lidar data are created equally. Different lidar data may have different attributes. In this activity, you will look at data that contain both intensity values and a ground vs non ground classification.
About plas.io
Plasio is a project by Uday Verma and Howard Butler that implements point cloud rendering capability in a browser. Specifically, it provides a functional implementation of the ASPRS LAS format, and it can consume LASzip-compressed data using LASzip NaCl module. Plasio is Chrome-only at this time, but it is hoped that other contributors can step forward to bring it to other browsers.
It is expected that most WebGL-capable browers should be able to support plasio, and it contains nothing that is explicitly Chrome-specific beyond the optional NaCL LASzip module. src: https://github.com/verma/plasio
1. Open a .las File in plas.io
- If you haven’t already, download the week 3 dataset - linked at the top of this
page. It contains several
.lazformat point cloud datasets that you will use in this lesson. - When the download is complete, drag one of the
.lazfiles into the plas.io website. window. - Zoom and pan around the data.
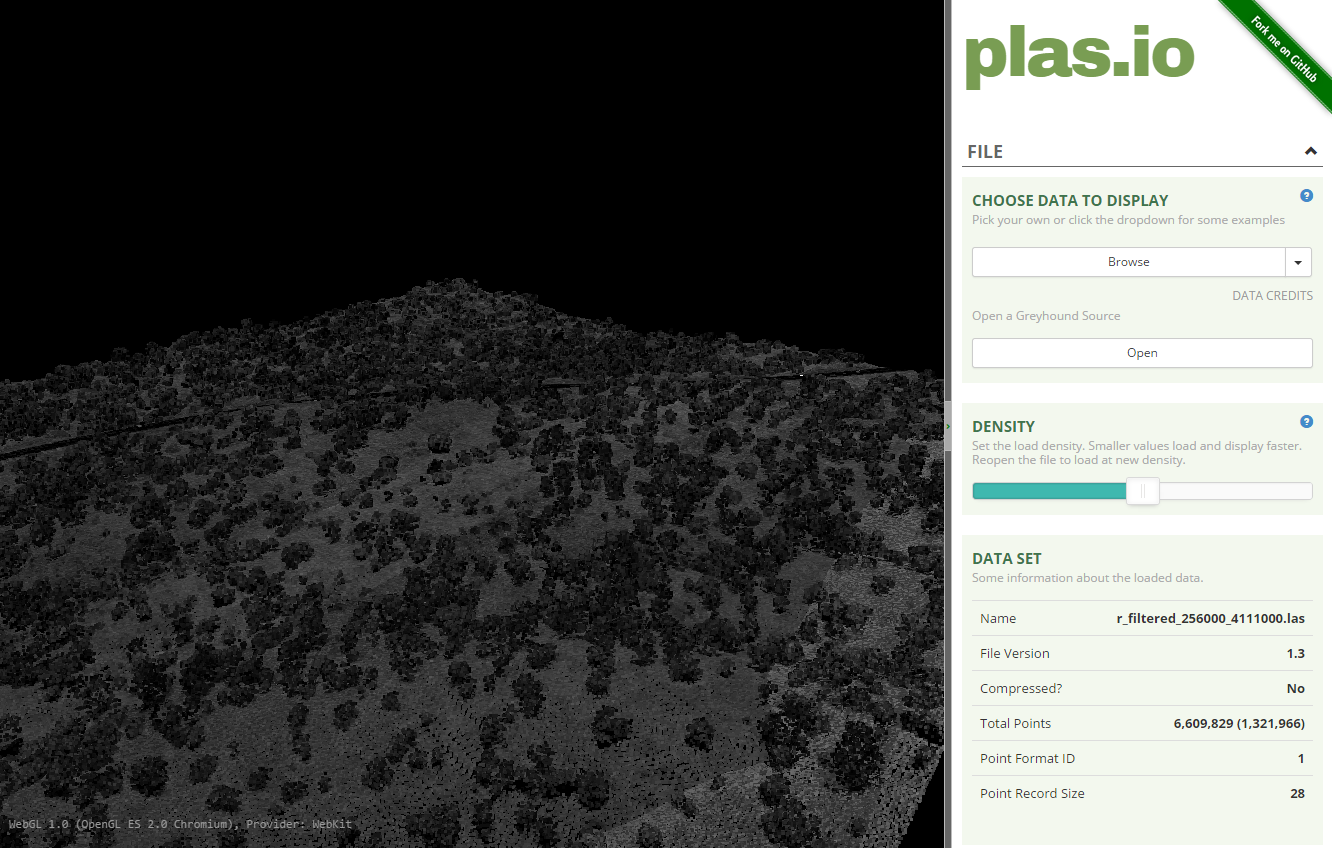
- Use the particle size slider to adjust the size of each individual lidar point.
NOTE: the particle size slider is located a little more than half way down the
plas.iotoolbar in the “Data” section
If the data imported into the plas.io viewer correctly, you should see something similar to the screenshot below:
Navigate Around Your Data in plas.io
You might prefer to use a mouse to explore your data in plas.io. Let’s test the
navigation out:
- Left click on the screen and drag the data on the screen. Notice that this tilts the data up and down
- Right click on the screen and drag noticing that this moves the entire dataset around
- Use the scroll bar on your mouse to zoom in and out
How the Points are Colored - Why is Everything Grey When the Data are Loaded?
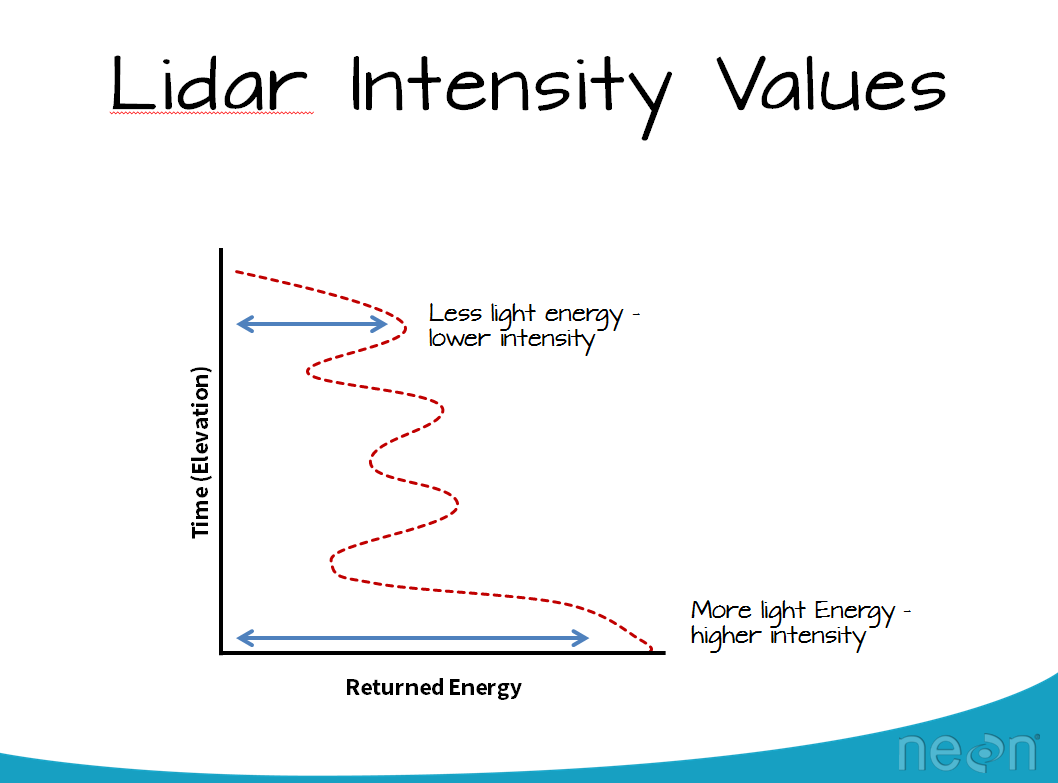
Notice that the data, upon initial view, are colored in a black - white color scheme. These colors represent the data’s intensity values. Remember that the intensity value for each lidar point represents the amount of light energy that reflected off of an object and returned to the sensor. In this case, darker colors represent LESS light energy returned. Lighter colors represent MORE light returned.
2. Adjust the Intensity Threshold
Next, scroll down through the tools in plas.io. Look for the Intensity Scaling slider.
The intensity scaling slider allows you to define the thresholds of light to dark
intensity values displayed in the image (similar to stretching values in an image
processing software or even in photoshop).
Drag the slider back and forth. Notice that you can brighten up the data using the slider.

3. Change the Lidar Point Cloud Color Options to Classification
In addition to intensity values, these lidar data also have a classification value. Lidar data classification values are numeric, ranging from 0-20 or higher. Some common classes include:
- 0 Not classified
- 1 Unassigned
- 2 Ground
- 3 Low vegetation
- 4 Medium vegetation
- 5 High vegetation
- 6 Building
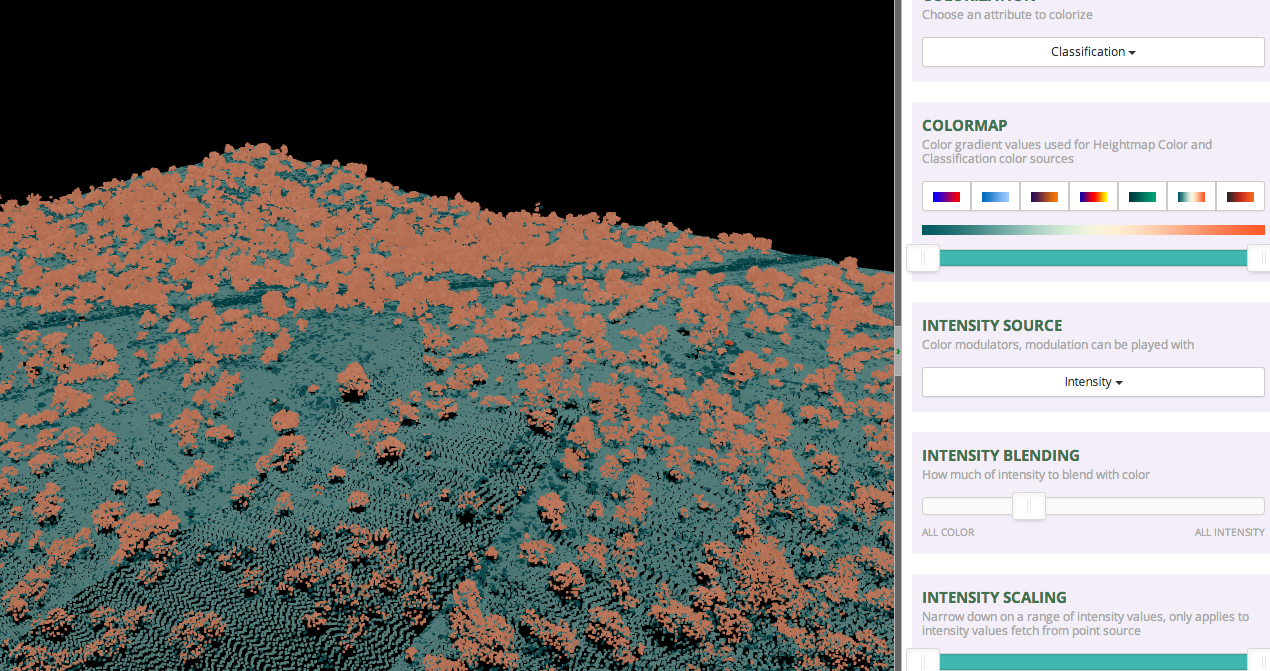
In this case, these data are classified as either ground, or non-ground. To view the points, colored by class:
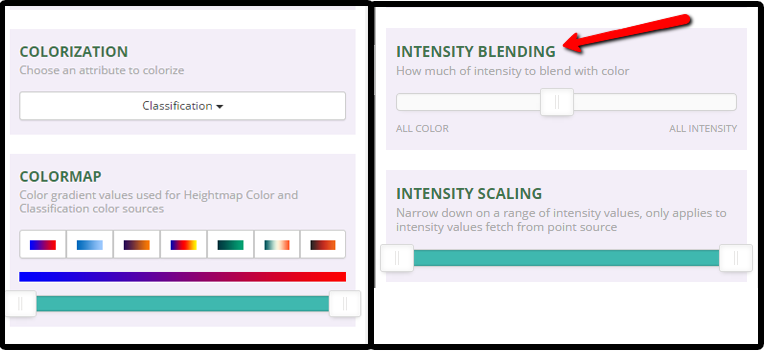
- Change the “colorization” setting to “Classification””
- Change the intensity blending slider to “All Color”
- For kicks - play with the various colormap options to change the colors of the points
4. Spend Some Time Exploring - Do You See Any Trees?
Finally, spend some time exploring the data. What features do you see in this dataset? What does the topography look like? Is the site flat? Hilly? Mountainous? What do the lidar data tell you, just upon initial inspection?
Summary
- The
plas.ioonline point cloud viewer allows you to quickly view and explore lidar data point clouds. - Each lidar data point will have an associated set of attributes. You can check the metadata to determine which attributes the dataset contains. NEON data, provided above, contain both classification and intensity values.
- Classification values represent the type of object that the light energy reflected off of. Classification values are often ground vs non ground. Some lidar data files might have buildings, water bodies and other natural and man made elements classified.
- Lidar data often has an intensity value associated with it. This represents the amount of light energy that reflected off an object and returned to the sensor.
Additional Resources
Share on
Twitter Facebook Google+ LinkedIn
Leave a Comment