Lesson 2. Work With Precipitation Data in R: 2013 Colorado Floods
In this lesson you will review a data driven report created by a “fictitious” colleague on the 2013 floods.
Learning Objectives
After completing this tutorial, you will be able to:
- List some of the components of a project that make it more easily reusable (reproducible) to you when working with other people.
What You Need
You will need a computer with internet access to complete this activity.
A Data Report
Your colleague put together the very informative data report below. The topic of the report is the 2013 Colorado floods. Examine the report. Then answer the questions below.
What do you know about the data used to generate the report?
- What sources of data were used to create the plots?
- How were the data processed?
- What units are the precipitation data in?
- Where were the data collected and how?
You would like to know about who contributed to the report and when.
- How did your colleague generate this report? When was it last updated?
- Who contributed to this report?
You are tasked with updating the report. Will that be difficult?
- You’d like to make some changes to the report - can you do that easily? If you wanted to make changes, what process and tools would you use to make those changes? Do you have everything that you need?
Last but not least…
- Create a list of the things that would make editing this report easier.
My Report - 2013 Colorado Flood Data
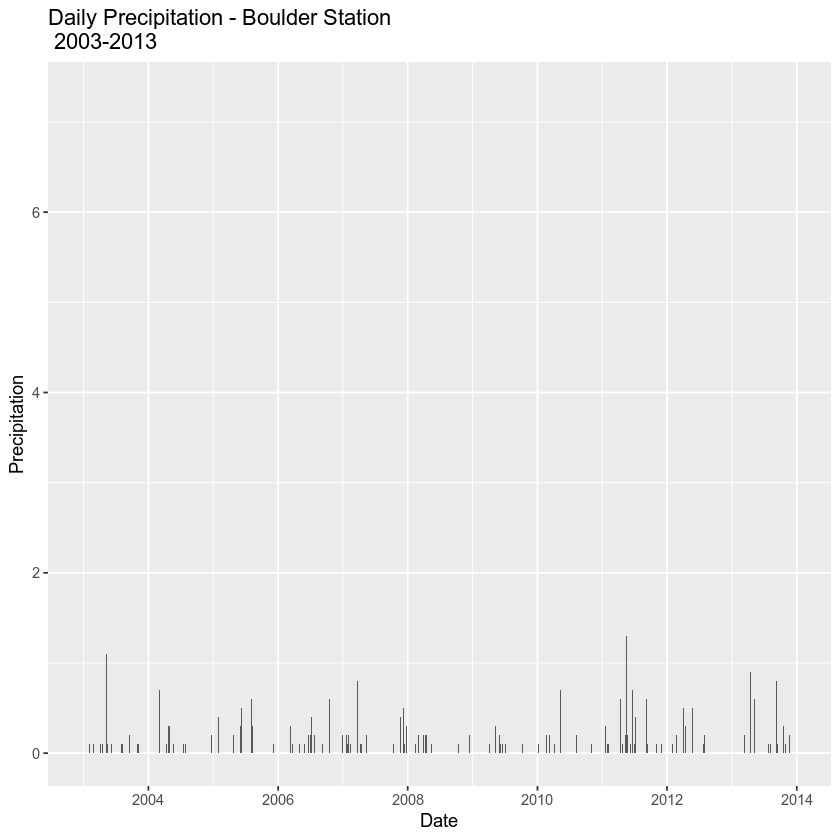
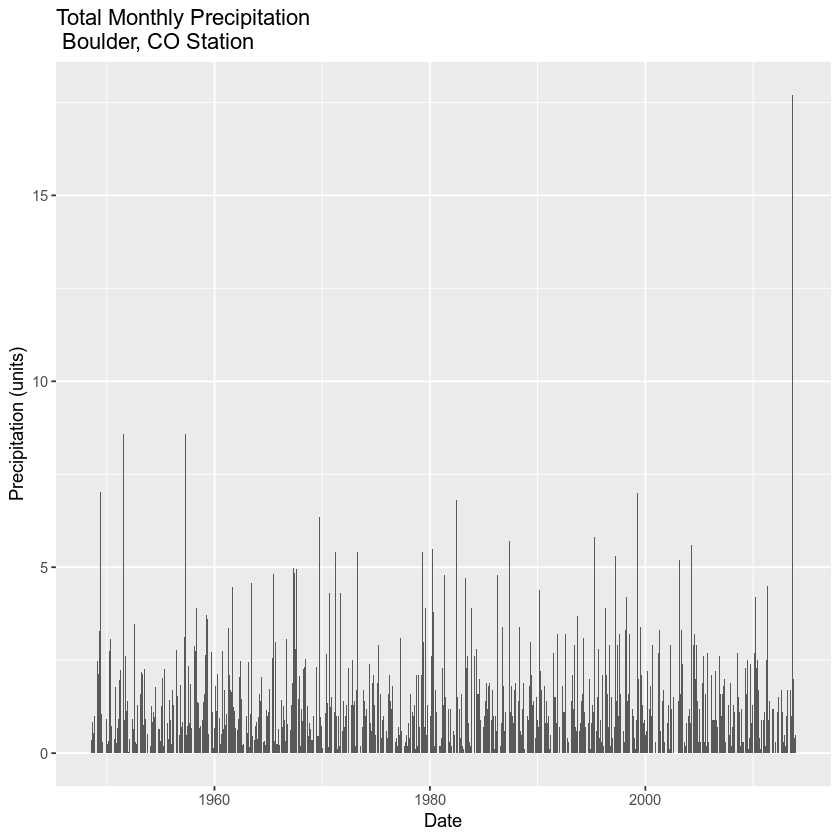
Precipitation Data
When a weather front passed through Colorado in 2013, a lot of rain impacted Colorado. See below.
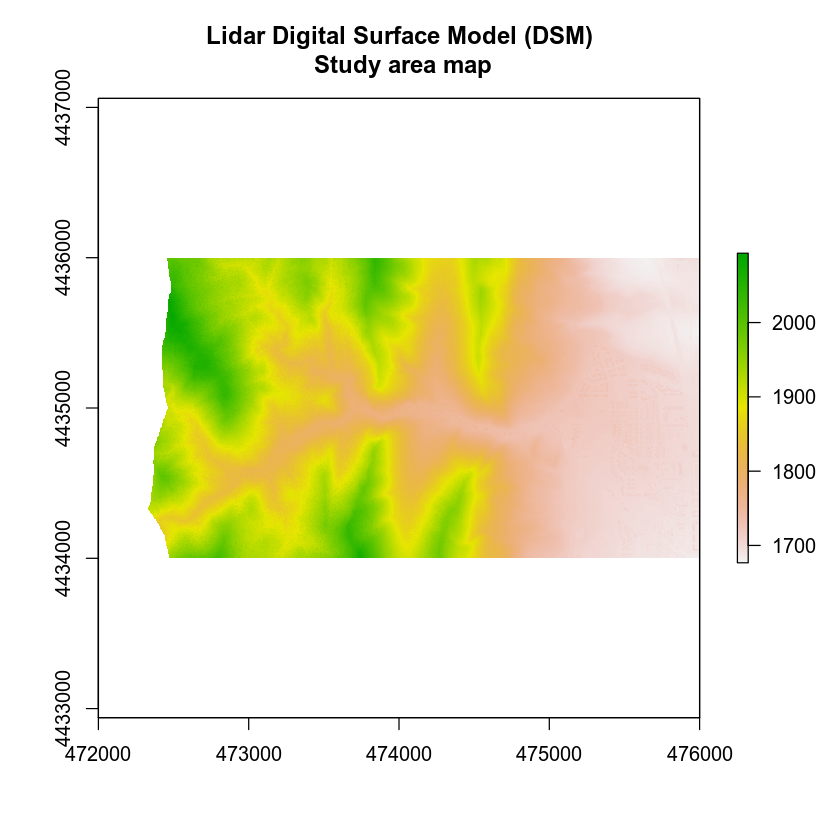
Some terrain data.
lidar_dsm <- raster(x = "data/week-03/BLDR_LeeHill/pre-flood/lidar/pre_DSM.tif")

# plot raster data
plot(lidar_dsm,
     main = "Lidar Digital Surface Model (DSM)\n Study area map")

download.file(url = "https://ndownloader.figshare.com/files/7270970",
             "data/week-01/805325-precip_daily_2003-2013.csv")

# import precip data into R data.frame
precip_boulder <- read.csv("data/week-01/805325-precip_daily_2003-2013.csv",
                           header = TRUE)


# convert to date/time and retain as a new field
precip_boulder$DateTime <- as.POSIXct(precip_boulder$DATE,
                                  format = "%Y%m%d %H:%M")

# assign NoData values to NA
precip_boulder$HPCP[precip_boulder$HPCP == 999.99] <- NA

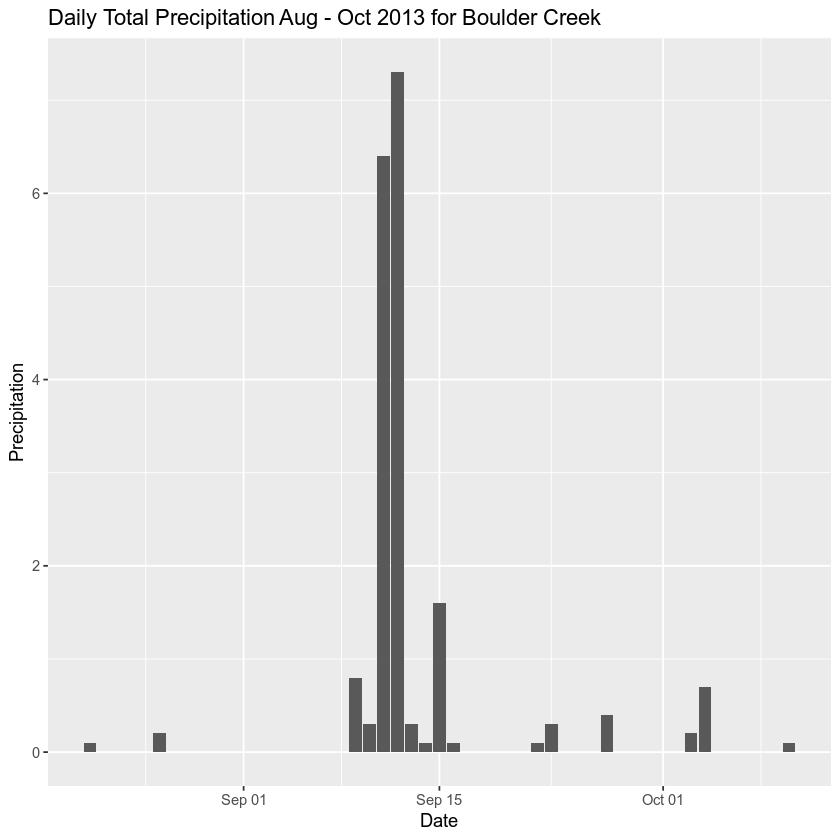
Fall 2013 Precipitation
Let’s check out the data for a few months.


Share on
Twitter Facebook Google+ LinkedIn
Leave a Comment