Lesson 6. Sentiment Analysis of Colorado Flood Tweets in R
Learning Objectives
After completing this tutorial, you will be able to:
- Use the
tidytextpackage inRto perform a sentiment analysis of tweets.
What You Need
You will need a computer with internet access to complete this lesson.
In the previous lessons you learned to use text mining approaches to understand what people are tweeting about and create maps of tweet locations. This lesson will take that analysis a step further by performing a sentiment analysis of tweets.
# json libraries
library(rjson)
library(jsonlite)
# plotting and pipes - tidyverse!
library(ggplot2)
library(dplyr)
library(tidyr)
library(tidytext)
# date time
library(lubridate)
library(zoo)

options(stringsAsFactors = FALSE)
# sentiment analysis
sentiments
## # A tibble: 6,786 x 2
##    word        sentiment
##    <chr>       <chr>
##  1 2-faces     negative
##  2 abnormal    negative
##  3 abolish     negative
##  4 abominable  negative
##  5 abominably  negative
##  6 abominate   negative
##  7 abomination negative
##  8 abort       negative
##  9 aborted     negative
## 10 aborts      negative
## # … with 6,776 more rows

# create file path
json_file <- "data/week-13/boulder_flood_geolocated_tweets.json"
# import json file line by line to avoid syntax errors
# this takes a few seconds
boulder_flood_tweets <- stream_in(file(json_file))
##
 Found 500 records...
 Found 1000 records...
 Found 1500 records...
 Found 2000 records...
 Found 2500 records...
 Found 3000 records...
 Found 3500 records...
 Found 4000 records...
 Found 4500 records...
 Found 5000 records...
 Found 5500 records...
 Found 6000 records...
 Found 6500 records...
 Found 7000 records...
 Found 7500 records...
 Found 8000 records...
 Found 8500 records...
 Found 9000 records...
 Found 9500 records...
 Found 10000 records...
 Found 10500 records...
 Found 11000 records...
 Found 11500 records...
 Found 12000 records...
 Found 12500 records...
 Found 13000 records...
 Found 13500 records...
 Found 14000 records...
 Found 14500 records...
 Found 15000 records...
 Found 15500 records...
 Found 16000 records...
 Found 16500 records...
 Found 17000 records...
 Found 17500 records...
 Found 18000 records...
 Found 18500 records...
 Found 18821 records...
 Imported 18821 records. Simplifying...

# create new df with the tweet text & usernames
tweet_data <- data.frame(date_time = boulder_flood_tweets$created_at,
                         username = boulder_flood_tweets$user$screen_name,
                         tweet_text = boulder_flood_tweets$text,
                         coords = boulder_flood_tweets$coordinates)

# flood start date sept 13 - 24 (end of incident)
start_date <- as.POSIXct('2013-09-13 00:00:00')
end_date <- as.POSIXct('2013-09-24 00:00:00')

# cleanup
flood_tweets <- tweet_data %>%
  mutate(date_time = as.POSIXct(date_time, format = "%a %b %d %H:%M:%S +0000 %Y")) %>%
  filter(date_time >= start_date & date_time <= end_date ) %>%
  mutate(tweet_text = gsub("http://*|https://*)", "", tweet_text))

data("stop_words")

# get a list of words
flood_tweet_clean <- flood_tweets %>%
  dplyr::select(tweet_text) %>%
  unnest_tokens(word, tweet_text) %>%
  anti_join(stop_words) %>%
  filter(!word %in% c("rt", "t.co"))


# plot the top 15 words -- notice any issues?
flood_tweet_clean %>%
  count(word, sort = TRUE) %>%
  top_n(15) %>%
  mutate(word = reorder(word, n)) %>%
  ggplot(aes(x = word, y = n)) +
  geom_col() +
  xlab(NULL) +
  coord_flip() +
  labs(x = "Count",
       y = "Unique words",
       title = "Count of unique words found in tweets")

Next, you can join the words extracted from the tweets with the sentiment data. The “bing” sentiment data classifies words as positive or negative. Note that other sentiment datasets use various classification approaches. You can learn more in the sentiment analysis chapter of the tidytext e-book.
# join sentiment classification to the tweet words
bing_word_counts <- flood_tweet_clean %>%
  inner_join(get_sentiments("bing")) %>%
  count(word, sentiment, sort = TRUE) %>%
  ungroup()
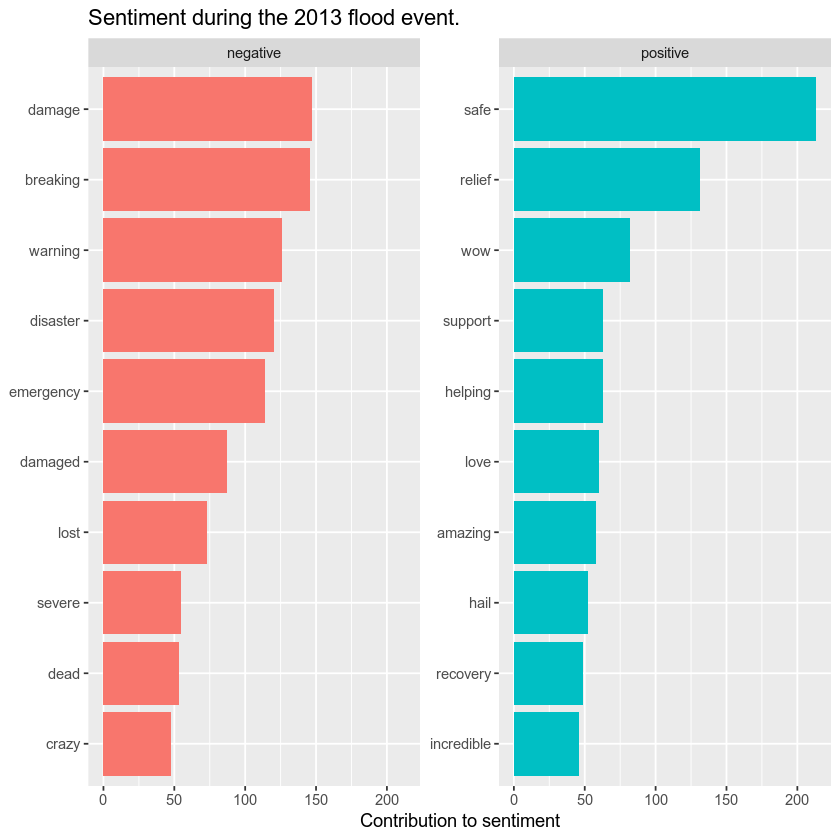
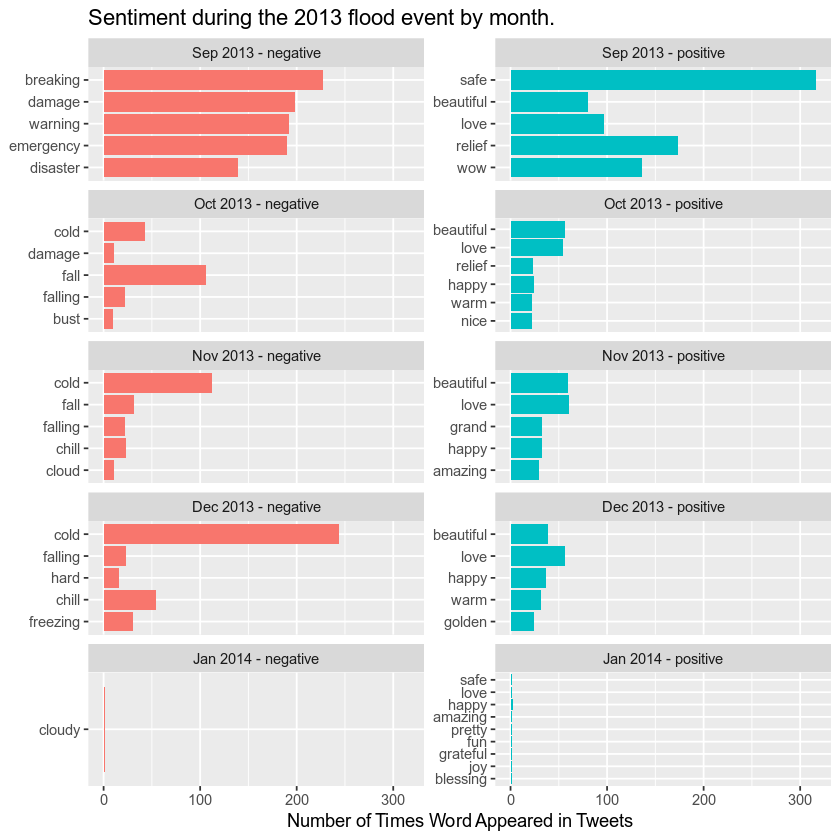
Finally, plot top words, grouped by positive vs. negative sentiment. Given you have a year’s worth of data associated with the flood event, it could be interesting to plot sentiment over time to see how sentiment changed over time.
bing_word_counts %>%
  group_by(sentiment) %>%
  top_n(10) %>%
  ungroup() %>%
  mutate(word = reorder(word, n)) %>%
  ggplot(aes(word, n, fill = sentiment)) +
  geom_col(show.legend = FALSE) +
  facet_wrap(~sentiment, scales = "free_y") +
  labs(title = "Sentiment during the 2013 flood event.",
       y = "Contribution to sentiment",
       x = NULL) +
  coord_flip()

# cleanup
flood_tweets_2013 <- tweet_data %>%
  mutate(date_time = as.POSIXct(date_time, format = "%a %b %d %H:%M:%S +0000 %Y")) %>%
  mutate(tweet_text = gsub("http://*|https://*)", "", tweet_text),
         month = as.yearmon(date_time))

# get a list of words
flood_tweet_clean_2013 <- flood_tweets_2013 %>%
  dplyr::select(tweet_text, month) %>%
  unnest_tokens(word, tweet_text) %>%
  anti_join(stop_words) %>%
  filter(!word %in% c("rt", "t.co"))


# plot the top 15 words -- notice any issues?
flood_tweet_clean_2013 %>%
  count(word, sort = TRUE) %>%
  top_n(15) %>%
  mutate(word = reorder(word, n)) %>%
  ggplot(aes(x = word, y = n)) +
  geom_col() +
  xlab(NULL) +
  coord_flip() +
  labs(x = "Count",
       y = "Unique words",
       title = "Count of unique words found in a year's worth of tweets")

# join sentiment classification to the tweet words
bing_sentiment_2013 <- flood_tweet_clean_2013 %>%
  inner_join(get_sentiments("bing")) %>%
  count(word, sentiment, month, sort = TRUE) %>%
  group_by(sentiment) %>%
  ungroup() %>%
  mutate(word = reorder(word, n)) %>%
  group_by(month, sentiment) %>%
  top_n(n = 5, wt = n) %>%
  # create a date / sentiment column for sorting
  mutate(sent_date = paste0(month, " - ", sentiment)) %>%
  arrange(month, sentiment, n)


bing_sentiment_2013$sent_date <- factor(bing_sentiment_2013$sent_date,
       levels = unique(bing_sentiment_2013$sent_date))


# group by month and sentiment and then plot top 5 words each month
bing_sentiment_2013 %>%
  ggplot(aes(word, n, fill = sentiment)) +
  geom_col(show.legend = FALSE) +
  facet_wrap(~sent_date, scales = "free_y", ncol = 2) +
  labs(title = "Sentiment during the 2013 flood event by month.",
       y = "Number of Times Word Appeared in Tweets",
       x = NULL) +
  coord_flip()

Additional Resources
Share on
Twitter Facebook Google+ LinkedIn
Leave a Comment