Lesson 4. Work with the Difference Normalized Burn Index - Using Spectral Remote Sensing to Understand the Impacts of Fire on the Landscape
Learning Objectives
After completing this tutorial, you will be able to:
- Calculate
dNBRinR. - Describe how the
dNBRindex is used to quantify fire severity.
What You Need
You will need a computer with internet access to complete this lesson and the data for week 8 of the course.
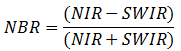
Calculate Normalized Burn Ratio (NBR)
The Normalized burn ratio (NBR) is used to identify burned areas. The formula is similar to a normalized difference vegetation index (NDVI), except that it uses near-infrared (NIR) and shortwave-infrared (SWIR) portions of the electromagnetic spectrum (Lopez, 1991; Key and Benson, 1995).
The NIR and SWIR parts of the electromagnetic spectrum are a powerful combination of bands to use for this index given vegetation reflects strongly in the NIR region of the electromagnetic spectrum and weekly in the SWIR. Alternatively, it has been shown that a fire scar which contains scarred woody vegetation and earth will reflect more strongly in the SWIR part of the electromagnetic spectrum and beyond (see figure below).

NBR Bands
The NBR index was originally developed for use with Landsat TM and ETM+ bands 4 and 7, but it will work with any multispectral sensor with a NIR band between 760 - 900 nm and a SWIR band between 2080 - 2350 nm. Thus this index can be used with both Landsat 8, MODIS and other multi (and hyper) spectral sensors.
Difference NBR
The Normalized Burn Ratio is most powerful as a tool to better understand fire extent and severity when used after calculating the difference between pre and post fire conditions. This difference is best measured using data collected immediately before the fire and then immediately after the fire. NBR is less effective if time has passed and vegetation regrowth / regeneration has begun after the fire. Once vegetation regeneration has begun, the fire scar will begin to reflect a stronger signal in the NIR portion of the spectrum because healthy plants reflect strongly in the NIR portion due to the properties of chlorophyll).
For this reason, the NBR ratio works better in areas like the United States where plant regeneration is expected to occur more slowly. In areas like the tropics which are wet and characterized by rapid regrowth, NBR may be less effective.
To calculate the difference NBR, you subtract the post-fire NBR raster from the pre-fire NBR raster as follows:

The classification table below can be used to classify the difference raster according to the severity of the burn.
| SEVERITY LEVEL | dNBR RANGE | |
|---|---|---|
| Enhanced Regrowth | < -.1 | |
| Unburned | -.1 to +.1 | |
| Low Severity | +.1 to +.27 | |
| Moderate Severity | +.27 to +.66 | |
| High Severity | > .66 |
How Severe is Severe?
It is important to keep in mind that that the classification table above is one quantitative interpretation of what the results of dNBR actually mean. The term “severity” is a qualitative term that could be quantified in different ways. For instance, who is to say that .5 couldn’t be representative of “high severity” vs .66?
As scientists, the best way to make sure your classification approaches represent what is actually happening on the ground in terms of fire severity is to check out the actual conditions on the ground. This process of confirming a value that you get from remote sensing data by checking it on the ground is called validation.
You learned about ground validation as it applies to lidar data in the lidar remote sensing uncertainty lessons.
NBR & Water - False Positives
The NBR index can be a powerful tool to identify pixels that have a high likelyhood or being “burned”. However it is important to know that this index is also sensitive to water and thus sometimes, pixels that are classified as “high severity” may actually be water. Because of this, it is important to mask out areas of water PRIOR to performing any quantitative analysis on the difference NBR results.
NBR & Landsat 8
The table below which shows the band distribution of Landsat 8. These bands are different from Landsat 7. What bands should you use to calculate NBR using Landsat 8?
Landsat 8 Bands
| Band | Wavelength range (nanometers) | Spatial Resolution (m) | Spectral Width (nm) |
|---|---|---|---|
| Band 1 - Coastal aerosol | 430 - 450 | 30 | 2.0 |
| Band 2 - Blue | 450 - 510 | 30 | 6.0 |
| Band 3 - Green | 530 - 590 | 30 | 6.0 |
| Band 4 - Red | 640 - 670 | 30 | 0.03 |
| Band 5 - Near Infrared (NIR) | 850 - 880 | 30 | 3.0 |
| Band 6 - SWIR 1 | 1570 - 1650 | 30 | 8.0 |
| Band 7 - SWIR 2 | 2110 - 2290 | 30 | 18 |
| Band 8 - Panchromatic | 500 - 680 | 15 | 18 |
| Band 9 - Cirrus | 1360 - 1380 | 30 | 2.0 |
NBR & MODIS
Similarly the table below shows the band ranges for the MODIS sensor. What bands should you use to calculate NBR using MODIS?
| Band | Wavelength range (nm) | Spatial Resolution (m) | Spectral Width (nm) |
|---|---|---|---|
| Band 1 - red | 620 - 670 | 250 | 2.0 |
| Band 2 - near infrared | 841 - 876 | 250 | 6.0 |
| Band 3 - blue/green | 459 - 479 | 500 | 6.0 |
| Band 4 - green | 545 - 565 | 500 | 3.0 |
| Band 5 - near infrared | 1230 – 1250 | 500 | 8.0 |
| Band 6 - mid-infrared | 1628 – 1652 | 500 | 18 |
| Band 7 - mid-infrared | 2105 - 2155 | 500 | 18 |
- Import the prefire raster
## OGR data source with driver: ESRI Shapefile
## Source: "/root/earth-analytics/data/week-08/vector_layers/fire-boundary-geomac", layer: "co_cold_springs_20160711_2200_dd83"
## with 1 features
## It has 21 fields

# bands 7 and 5
landsat_prefire_nbr <- overlay(all_landsat_bands_173_br[[7]], all_landsat_bands_173_br[[5]],
        fun = normalized_diff)

plot(landsat_prefire_nbr,
     main = "Landsat-derived NBR\n Pre-Fire \n with fire boundary overlay",
     axes = FALSE,
     box = FALSE)
plot(fire_boundary_utm,
     add = TRUE)

Now you can calculate the difference NBR (pre fire minus post fire )
diff_nbr <- landsat_prefire_nbr - landsat_postfire_nbr
When you have calculated NBR - classify the output raster using the classify()
function and the classes below.
| SEVERITY LEVEL | dNBR RANGE | |
|---|---|---|
| Enhanced Regrowth | > -.1 | |
| Unburned | -.1 to + .1 | |
| Low Severity | +.1 to +.27 | |
| Moderate Severity | +.27 to +.66 | |
| High Severity | > +.66 |
NOTE: your min an max values for NBR may be slightly different from the table shown above! If you have a smaller min value (< -700) then adjust your first class to that smallest number. If you have a largest max value (>1300) then adjust your last class to that largest value in your data.
Alternatively, you can set those values to NA if you think they are outside of the valid range of NBR (in this case they are not).
You R classified map should look something like:

barplot(nbr_classified,
        main = "Distribution of Classified NBR Values",
        col = the_colors,
        names.arg = c("Enhanced \nRegrowth", "Unburned", "Low \n Severity", "Moderate \n Severity", "High \nSeverity"))

Additional Resources
Share on
Twitter Facebook Google+ LinkedIn
Leave a Comment